Difference between revisions of "Liquid Waste Nitrification"
From Living Building Science
m (→Team Members) |
m (→Team Members) |
||
| Line 1,258: | Line 1,258: | ||
|mcardelino3@gatech.edu | |mcardelino3@gatech.edu | ||
|Environmental Engineering | |Environmental Engineering | ||
| − | |2020 - | + | |2020 - 2021 |
|- | |- | ||
|[[Shalini's Notebook|Shalini Udawatte]] | |[[Shalini's Notebook|Shalini Udawatte]] | ||
|sudawatte3@gatech.edu | |sudawatte3@gatech.edu | ||
|Chemistry | |Chemistry | ||
| − | |2021 | + | |2021 |
|- | |- | ||
|Trevor Morelock | |Trevor Morelock | ||
Revision as of 15:08, 24 November 2021
Contents
Overview
The Kendeda Building, funded by the Kendeda Fund, was designed and constructed to achieve the Living Building Challenge. The challenge consists of seven petals: Place Petal, Water Petal, Energy Petal, Health & Happiness Petal, Materials Patel, Equity Petal, and Beauty Petal. The interest of the Liquid Waste Nitrification Project lies within the Water Petal. The Georgia Tech Kendeda Building achieves the water petal by "converting rainwater to drinking water, managing waste [grey] water to recharge the landscape, and minimizing stormwater runoff." However, a blackwater system is not present within this project. Instead, twelve composting toilets and four urinals were installed throughout the building to separate liquids and convert solids into fertilizing soil which can be used for uptake by plants. The separated liquid, however, is stored within a storage tank and then collected and transported to a nearby wastewater treatment plant.
Kendeda Wastewater System
The Kendeda Building's blackwater system employs waterless, Nepon foam-flush toilets and Gerber waterless urinals which drain into a set of Clivus Multrum M35 Automatic Composters located in the basement of the building.
The Clivus Multrum M35 Automatic Composter is a mesophilic composter that utilizes a long retention system for pathogen removal (NSF Certified: Standard 41). It is also equipped with a urine diversion system which introduces Nitrobacter and Nitrosomonas into the blackwater, then pumps the liquid end-product into a secondary storage tank. The solid waste is stored within the original tank where aerobic fecal decomposition takes place. The solid waste environment is carefully regulated by an automatic moistening system and 980 controller.
PROBLEM: The separated liquid blackwater is handled unsustainably, and although it meets the standards of the Water Petal for which the building was designed, we believe we can improve and enhance the process to make it more sustainable.
The liquid storage tank is emptied on a monthly once basis. This requires a truck to be driven out to the Georgia Tech Kendeda Building, the liquid waste to be mechanically pumped out of the tank, the truck to be driven back to the wastewater treatment plant, and finally, the wastewater treatment plant introduces the liquid waste into its pre-existing blackwater load, where it then follows through the typical wastewater treatment cycle.

Liquid Waste Nitrification Project
Project Objective: Engineer a complementary system to the pre-existing blackwater infrastructure that treats the blackwater on site and successfully converts it into usable liquid fertilizer that can be used for the uptake of plants on and off-campus.
Research Hypothesis: If liquid end-product storage tanks used in human waste decomposition practices are set to ideal nitrifying bacteria growth conditions, with respect to dissolved oxygen saturation, and pH, then nitrate by-product concentration should achieve optimal levels (per volume of liquid waste).
Research Procedure
Materials
| Aluminum Foil | Aquarium Stone | Beaker/Buckets | Bio-Spira Aquarium Bacteria | Graduated Cylinders | Disposable Glove | Disposable Face Mask | Dissolved Oxygen Probe |
| DI Water | Erlenmeyer Flask | Ethanol | Lab Coats | Incubator | Micropipette | Nitrate/Ammonium Probe | pH Probe |
| pH Strips | Safety Glasses | Scale | Scoopula | TAPSO Buffer | Temperature Probe | Urea Crystals | Vernier Graphical Analysis |
| Vernier Lab Quest | Weigh Boats |
Methods
TAPSO Buffer
Considering the nitrification of Urea and the pKa of the subjective molecules within this reaction, we calculated the respective concentration of H+ within the solution. Analyzing TAPSO through the lens of its nucleophilic properties allowed us to calculate the respective molar ratio to utilize the accurate moles of TAPSO within our experiment. The H+ attack the nucleophilic site on nitrogen, which is a 1:1 ratio. Therefore one mole of TAPSO is equivalent to one mole of Hydrogen. However, we increased the ratio to be 2:1 to ensure that there is enough TAPSO. The mathematical calculation to find the proper amount of TAPSO goes by taking the moles of Urea, using the 2:1 ratio, and finally converting it into grams.
Function:
0.00518 M (Urea) .48 L = .0024864 mols
[2:1 Ratio] .0024864 mols 2 =.0049728 mols
0.0049278 mols 259.27 gmols (TAPSO)= 1.289 g of TAPSO
Nitrifying Bacteria
Our experiment makes use of the natural processes exhibited by nitrifying bacteria. The four bacteria specimens shown in the figure below are contained in Bio-Spira Aquatic Bacteria Solution. The first part of the reaction, Urea to NH3, occurs naturally in the presence of water, and the conversion of NH3 and NH4 is driven by the pH of the solution. Both Nitrosomonas and Nitrosospira perform the reactions that convert ammonium to nitrite, Nitrococcus performs the oxidation of nitrite to nitrate, and Nitrospira is a unique bacteria that can convert ammonium straight to nitrate. All of these reactions require different optimal temperature, pH, and DO conditions; however, they all tend to lie around the ideal conditions for Nitrospira which is a temperature of 33-44 ℃ and a pH of 7.6-8.0.

Phase II Standard Operating Procedure
Initial Laboratory Procedure
- Create 1.08L of 0.1548M (9.23 g/L) Urea Solution
- Separate into 9 Beakers with 0.12L of Solution in each
- Label Beakers from 1-9, set up bubbling mechanism in incubator
- Add 0.2 mL of Bio-Spira Marine Bacteria into every beaker
Daily Laboratory Procedure
- Calibrate Equipment
- Create 0.27 L of 0.1548M Urea Solution
- Test Conditions:
- Temperature ( C )
- pH w/ probe and strip
- Dissolved Oxygen (mg/L)
- Nitrate (mg/L)
- Ammonium (mg/L)
- Add 30 mL of 0.1548M Urea Solution to EVERY subject (to counteract evaporative losses and mimic daily addition of liquid waste to leachate tank)
- Add data to excel document
Research Data
TEMPERATURE
| TEMPERATURE (℃) | |||||||||
| CONTROL GROUP | EXPERIMENTAL GROUP 1 | EXPERIMENTAL GROUP 2 | |||||||
| DAY | #1 | #2 | #3 | #4 | #5 | #6 | #7 | #8 | #9 |
| 0 | 21.0 | 21.0 | 21.0 | 21.0 | 21.0 | 21.0 | 21.0 | 21.0 | 21.0 |
| 1 | 30.2 | 30.3 | 30.1 | 27.0 | 27.4 | 26.7 | 26.1 | 26.5 | 25.7 |
| 2 | 30.5 | 30.6 | 30.5 | 27.3 | 28.0 | 27.5 | 26.5 | 27.2 | 26.9 |
| 3 | 30.1 | 30.6 | 30.0 | 27.2 | 26.4 | 26.7 | 26.6 | 27.7 | 28.4 |
| 4 | 30.0 | 29.5 | 29.3 | 26.0 | 26.9 | 26.5 | 27.4 | 26.3 | 26.0 |
| 5 | 29.6 | 30.0 | 30.0 | 25.9 | 27.4 | 26.8 | 27.3 | 27.2 | 26.3 |
| 6 | 29.8 | 29.9 | 30.0 | 25.5 | 27.5 | 27.4 | 28.2 | 27.5 | 26.8 |
| 7 | 28.1 | 27.9 | 29.7 | 25.0 | 26.8 | 27.2 | 27.5 | 27.4 | 27.3 |
| 8 | - | - | - | - | - | - | - | - | - |
| 9 | 29.6 | 29.7 | 29.8 | 24.7 | 25.4 | 26.7 | 27.8 | 27.1 | 27.4 |
| 10 | 29.9 | 27.8 | 30.0 | 25.6 | 26.7 | 27.5 | 25.6 | 27.0 | 28.0 |
| 11 | 29.6 | 29.8 | 29.1 | 26.9 | 27.7 | 27.6 | 27.2 | 27.9 | 26.8 |
| 12 | 29.7 | 29.3 | 29.0 | 24.7 | 26.8 | 27.0 | 25.1 | 25.9 | 26.4 |
| 13 | 29.4 | 29.9 | 30.0 | 26.0 | 26.3 | 27.8 | 26.9 | 27.6 | 26.3 |
| 14 | 29.9 | 29.9 | 29.7 | 25.3 | 28.0 | 27.1 | 27.2 | 26.0 | 28.6 |
| 15 | - | - | - | - | - | - | - | - | - |
| 16 | 29.6 | 30.0 | 29.9 | 25.8 | 26.4 | 27.6 | 27.4 | 27.8 | 26.5 |
| 17 | 29.6 | 29.4 | 30.0 | - | 26.2 | 25.4 | 26.6 | 25.5 | 28.5 |
DISSOLVED OXYGEN
| DISSOLVED OXYGEN (mg/L) | |||||||||
| CONTROL GROUP | EXPERIMENTAL GROUP 1 | EXPERIMENTAL GROUP 2 | |||||||
| DAY | #1 | #2 | #3 | #4 | #5 | #6 | #7 | #8 | #9 |
| 0 | 9.12 | 9.12 | 9.12 | 9.12 | 9.12 | 9.12 | 9.12 | 9.12 | 9.12 |
| 1 | 8.25 | 8.00 | 7.97 | 8.30 | 7.84 | 8.03 | 8.50 | 8.49 | 8.01 |
| 2 | 7.05 | 7.31 | 8.07 | 8.56 | 8.54 | 8.40 | 8.71 | 9.05 | 8.52 |
| 3 | 7.80 | 7.24 | 8.03 | 8.52 | 7.84 | 8.51 | 9.20 | 8.95 | 8.55 |
| 4 | 8.51 | 8.75 | 8.53 | 8.59 | 8.73 | 8.90 | 8.79 | 8.80 | 8.95 |
| 5 | 8.82 | 8.18 | 8.40 | 8.99 | 9.04 | 8.84 | 8.66 | 8.53 | 8.59 |
| 6 | 7.11 | 8.35 | 8.84 | 9.03 | 9.22 | 8.86 | 8.93 | 8.88 | 9.05 |
| 7 | 8.44 | 7.48 | 7.93 | 9.89 | 9.78 | 9.66 | 10.75 | 10.10 | 10.40 |
| 8 | - | - | - | - | - | - | - | - | - |
| 9 | 7.88 | 8.36 | 8.52 | 8.78 | 8.85 | 8.86 | 8.70 | 8.34 | 8.78 |
| 10 | 9.90 | 9.40 | 8.90 | 11.14 | 10.38 | 10.87 | 10.18 | 9.75 | 9.49 |
| 11 | - | 8.41 | 8.55 | 8.46 | 8.66 | 8.66 | 8.83 | 8.90 | 8.92 |
| 12 | 8.94 | 8.40 | 8.25 | 9.36 | 9.62 | 9.29 | 9.95 | 9.95 | 9.51 |
| 13 | 8.86 | 7.45 | 8.20 | 9.18 | 9.64 | 8.90 | 8.56 | 8.98 | 9.62 |
| 14 | 9.38 | 9.25 | 9.76 | 8.96 | 9.85 | 9.85 | 11.17 | 10.90 | 9.71 |
| 15 | - | - | - | - | - | - | - | - | - |
| 16 | 9.84 | 9.13 | 9.82 | 9.03 | 9.96 | 9.43 | 10.43 | 9.55 | 9.85 |
| 17 | 8.77 | 8.56 | 8.67 | - | 9.03 | 8.79 | 8.82 | 8.97 | 8.44 |
pH
| pH | |||||||||
| CONTROL GROUP | EXPERIMENTAL GROUP 1 | EXPERIMENTAL GROUP 2 | |||||||
| DAY | #1 | #2 | #3 | #4 | #5 | #6 | #7 | #8 | #9 |
| 0 | 9.96 | 9.96 | 9.96 | 9.96 | 9.96 | 9.96 | 9.96 | 9.96 | 9.96 |
| 1 | 9.25 | 9.32 | 9.20 | 6.38 | 6.07 | 6.20 | 8.59 | 8.49 | 8.65 |
| 2 | 8.62 | 8.68 | 8.76 | 6.54 | 6.31 | 6.2 | 8.60 | 8.76 | 8.69 |
| 3 | 8.13 | 7.84 | 8.45 | 6.77 | 6.68 | 6.58 | 8.72 | 8.71 | 8.23 |
| 4 | 8.21 | 8.30 | 7.87 | 6.58 | 6.50 | 6.48 | 7.96 | 8.19 | 8.02 |
| 5 | 8.66 | 8.33 | 8.15 | 6.71 | 6.64 | 6.62 | 8.27 | 8.53 | 8.91 |
| 6 | 8.03 | 8.29 | 8.84 | 6.78 | 6.72 | 6.66 | 8.03 | 8.19 | 8.12 |
| 7 | 8.32 | 8.23 | 8.29 | 6.85 | 6.81 | 6.77 | 8.35 | 8.58 | 8.38 |
| 8 | - | - | - | - | - | - | - | - | - |
| 9 | 7.93 | 7.85 | 7.87 | 6.91 | 6.96 | 6.90 | 8.30 | 8.26 | 8.05 |
| 10 | 8.17 | 8.19 | 7.92 | 6.90 | 6.85 | 7.10 | 8.25 | 8.45 | 8.26 |
| 11 | 8.14 | 7.71 | 7.87 | 6.98 | 6.99 | 6.96 | 8.23 | 8.43 | 8.33 |
| 12 | 8.01 | 8.01 | 8.18 | 7.04 | 7.03 | 7.08 | 8.40 | 8.40 | 8.38 |
| 13 | 8.20 | 8.03 | 7.92 | 7.08 | 7.09 | 8.90 | 8.56 | 8.03 | 8.40 |
| 14 | 8.11 | 8.01 | 7.93 | 7.07 | 7.01 | 7.12 | 8.33 | 8.37 | 8.38 |
| 15 | - | - | - | - | - | - | - | - | - |
| 16 | 8.23 | 8.14 | 7.85 | 7.03 | 7.08 | 7.05 | 8.54 | 7.96 | 8.50 |
| 17 | 8.20 | 7.93 | 8.11 | - | 7.21 | 7.26 | 8.36 | 8.33 | 8.44 |
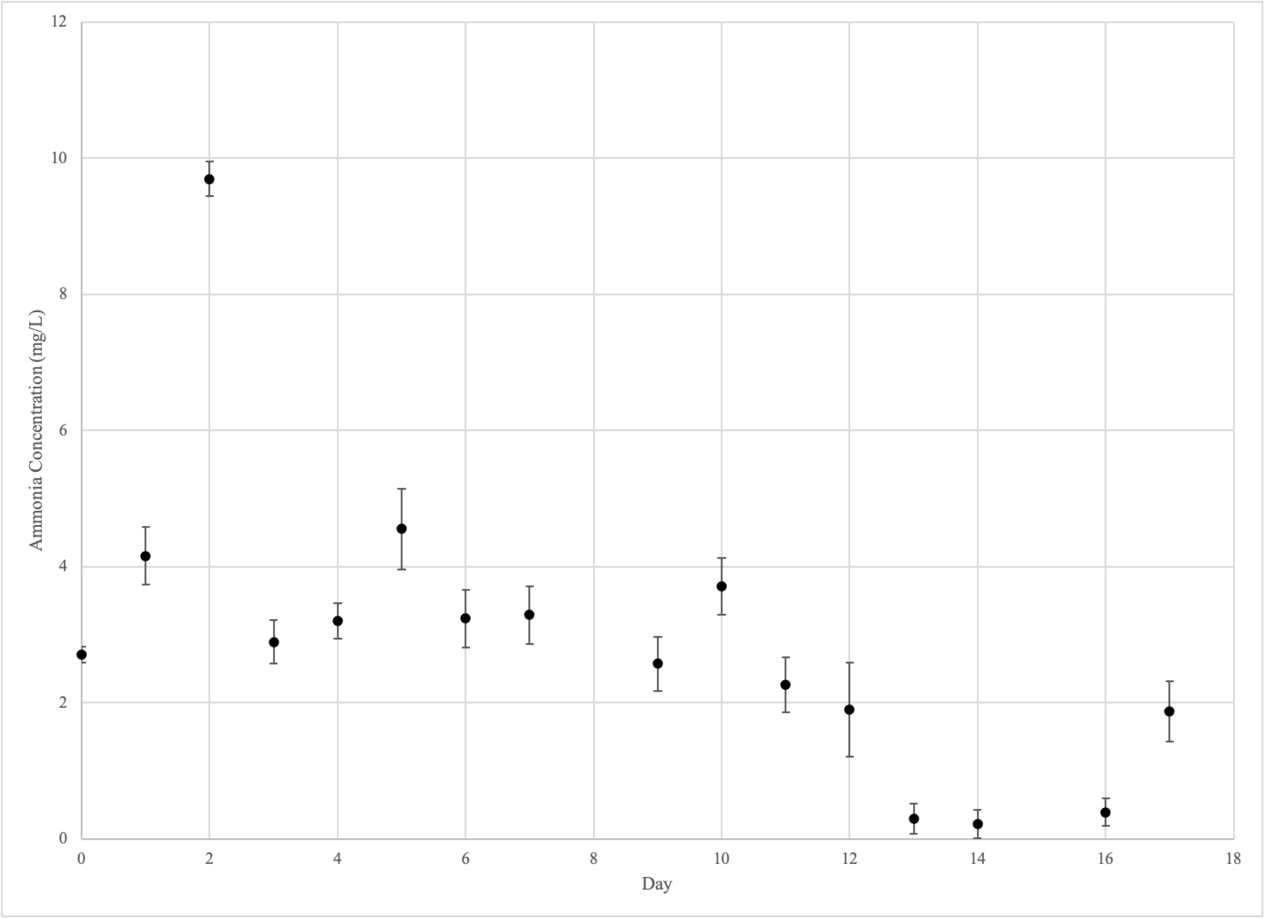
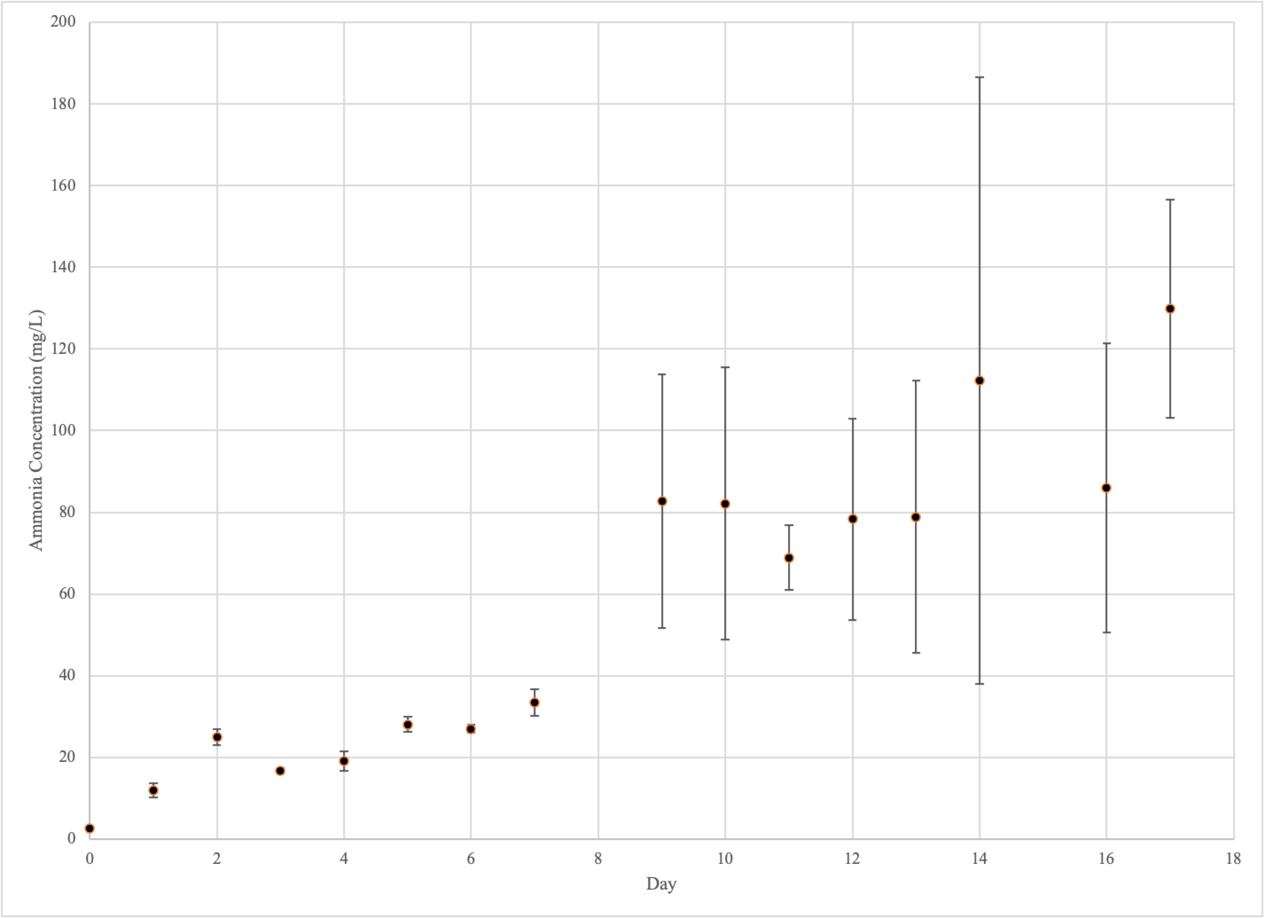
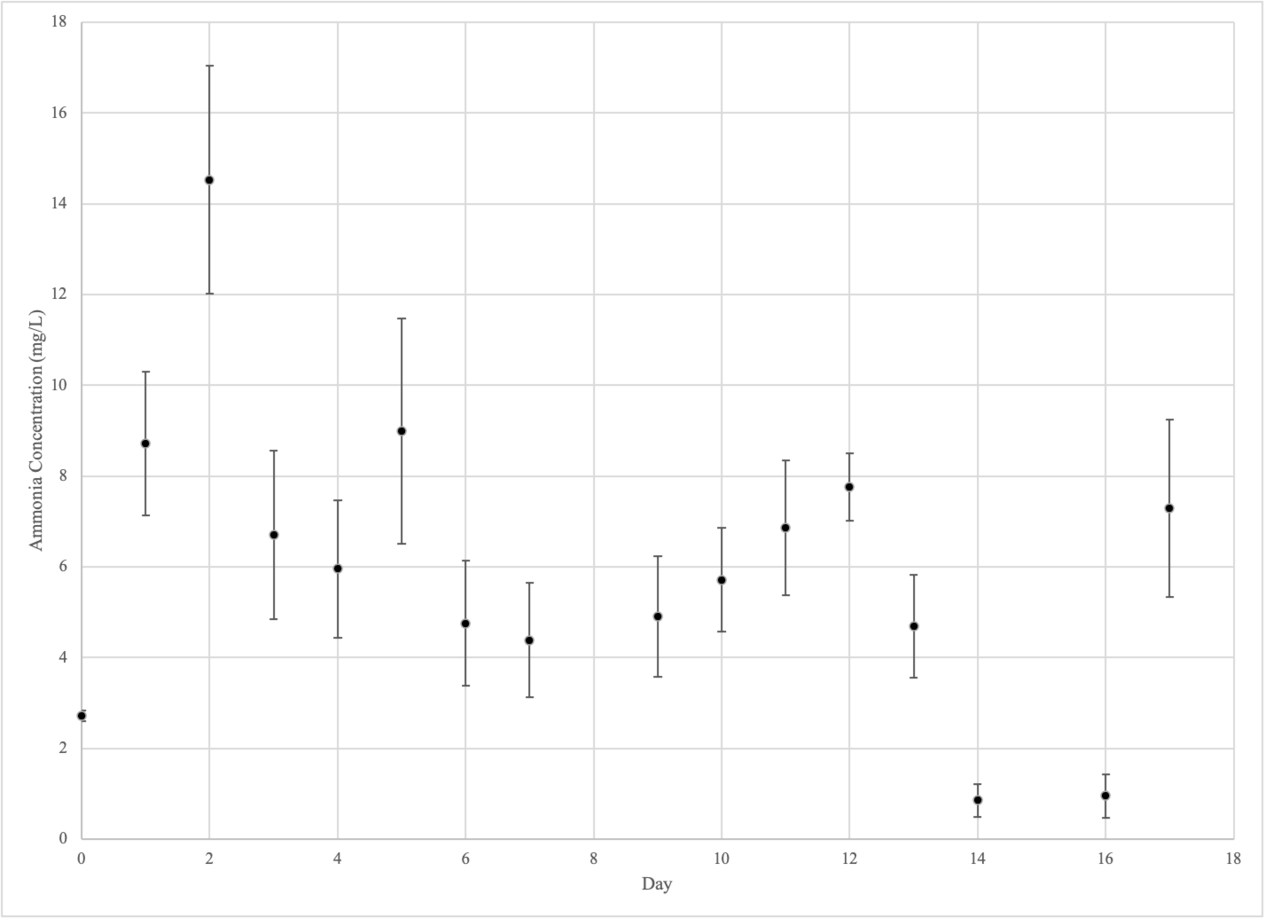
AMMONIUM
| AMMONIUM (mg/L) | |||||||||
| CONTROL GROUP | EXPERIMENTAL GROUP 1 | EXPERIMENTAL GROUP 2 | |||||||
| DAY | #1 | #2 | #3 | #4 | #5 | #6 | #7 | #8 | #9 |
| 0 | 2.71 | 2.71 | 2.71 | 2.71 | 2.71 | 2.71 | 2.71 | 2.71 | 2.71 |
| 1 | 3.55 | 4.46 | 4.47 | 9.42 | 15.00 | 11.43 | 5.80 | 10.46 | 9.86 |
| 2 | 9.87 | 9.78 | 9.43 | 22.94 | 28.63 | 23.34 | 13.78 | 18.99 | 10.80 |
| 3 | 3.20 | 2.52 | 2.96 | 16.71 | 17.56 | 15.98 | 8.09 | 8.77 | 3.24 |
| 4 | 2.95 | 3.23 | 3.44 | 14.51 | 21.23 | 21.71 | 6.55 | 8.02 | 3.30 |
| 5 | 4.61 | 5.35 | 3.70 | 25.81 | 26.82 | 31.62 | 12.36 | 10.17 | 4.45 |
| 6 | 2.64 | 3.52 | 3.56 | 26.64 | 28.81 | 25.62 | 6.33 | 5.68 | 2.26 |
| 7 | 2.83 | 3.85 | 3.19 | 38.26 | 34.55 | 27.67 | 6.06 | 4.88 | 2.20 |
| 8 | - | - | - | - | - | - | - | - | - |
| 9 | 2.28 | 2.30 | 3.14 | 144.57 | 53.69 | 49.84 | 5.95 | 6.26 | 2.50 |
| 10 | 3.38 | 3.45 | 4.30 | 148.50 | 51.77 | 46.21 | 6.42 | 7.03 | 3.69 |
| 11 | 2.72 | 1.75 | 2.33 | 84.36 | 60.03 | 62.03 | 6.41 | 9.43 | 4.74 |
| 12 | 1.01 | 1.72 | 2.97 | 126.78 | 47.58 | 60.53 | 6.50 | 11.46 | 4.53 |
| 13 | 0.51 | 0.22 | 0.18 | 144.92 | 39.55 | 52.15 | 4.20 | 6.63 | 3.23 |
| 14 | 0.39 | 0.12 | 0.15 | 260.02 | 27.65 | 48.96 | 0.74 | 1.32 | 0.51 |
| 15 | - | - | - | - | - | - | - | - | - |
| 16 | 0.56 | 0.28 | 0.35 | 156.65 | 49.95 | 51.43 | 0.53 | 1.67 | 0.67 |
| 17 | 2.34 | 1.26 | 2.03 | - | 103.30 | 156.49 | 6.45 | 10.79 | 4.62 |
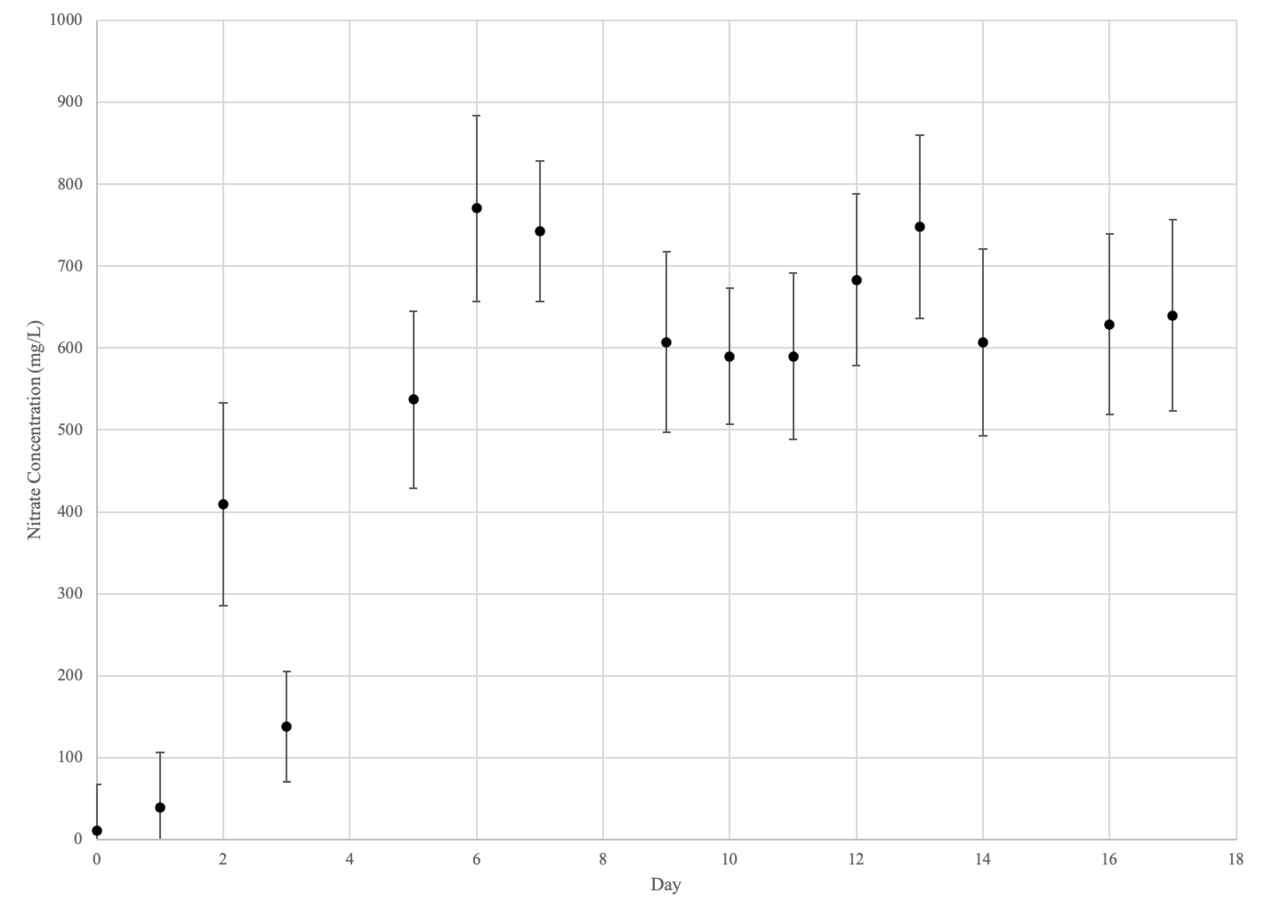
NITRATE
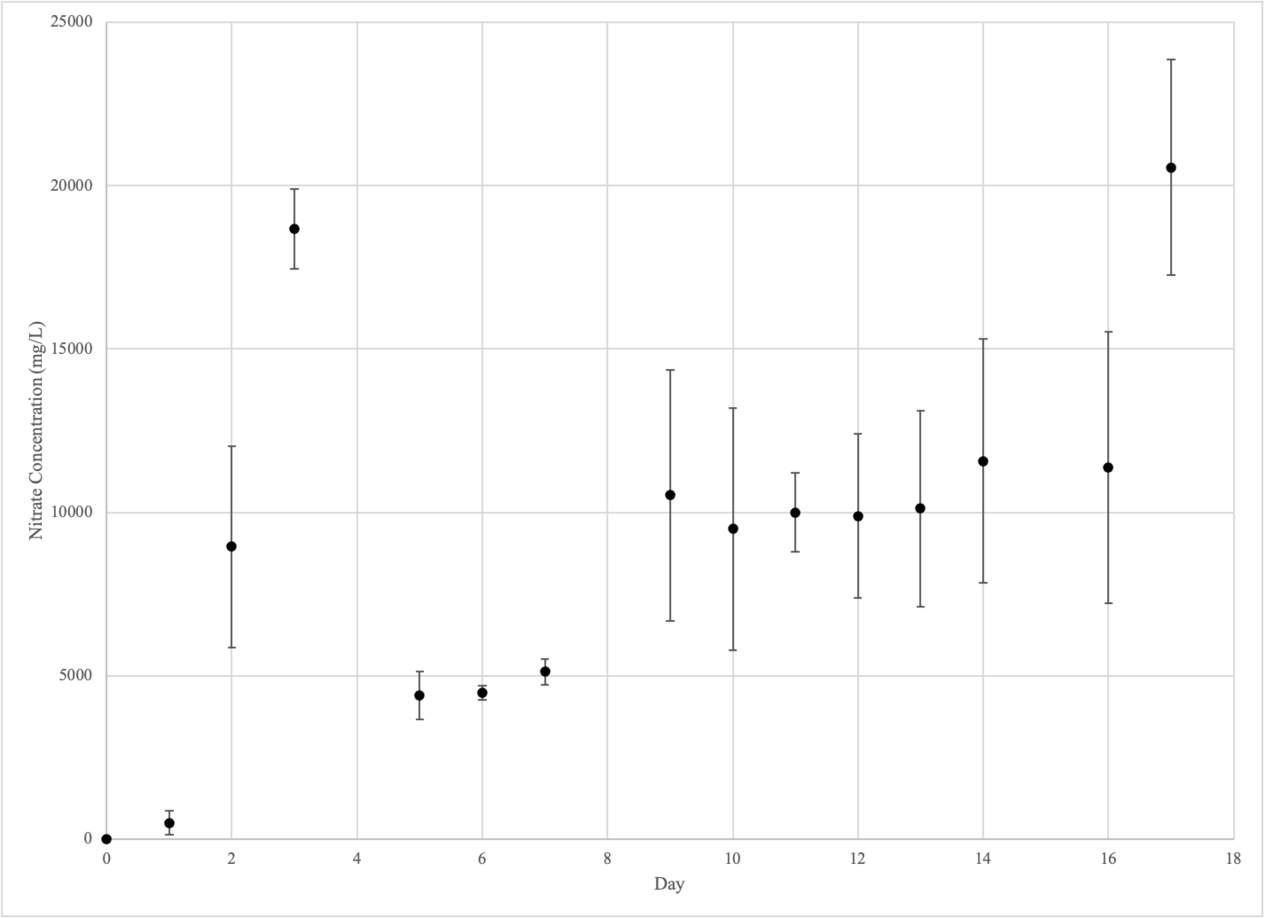
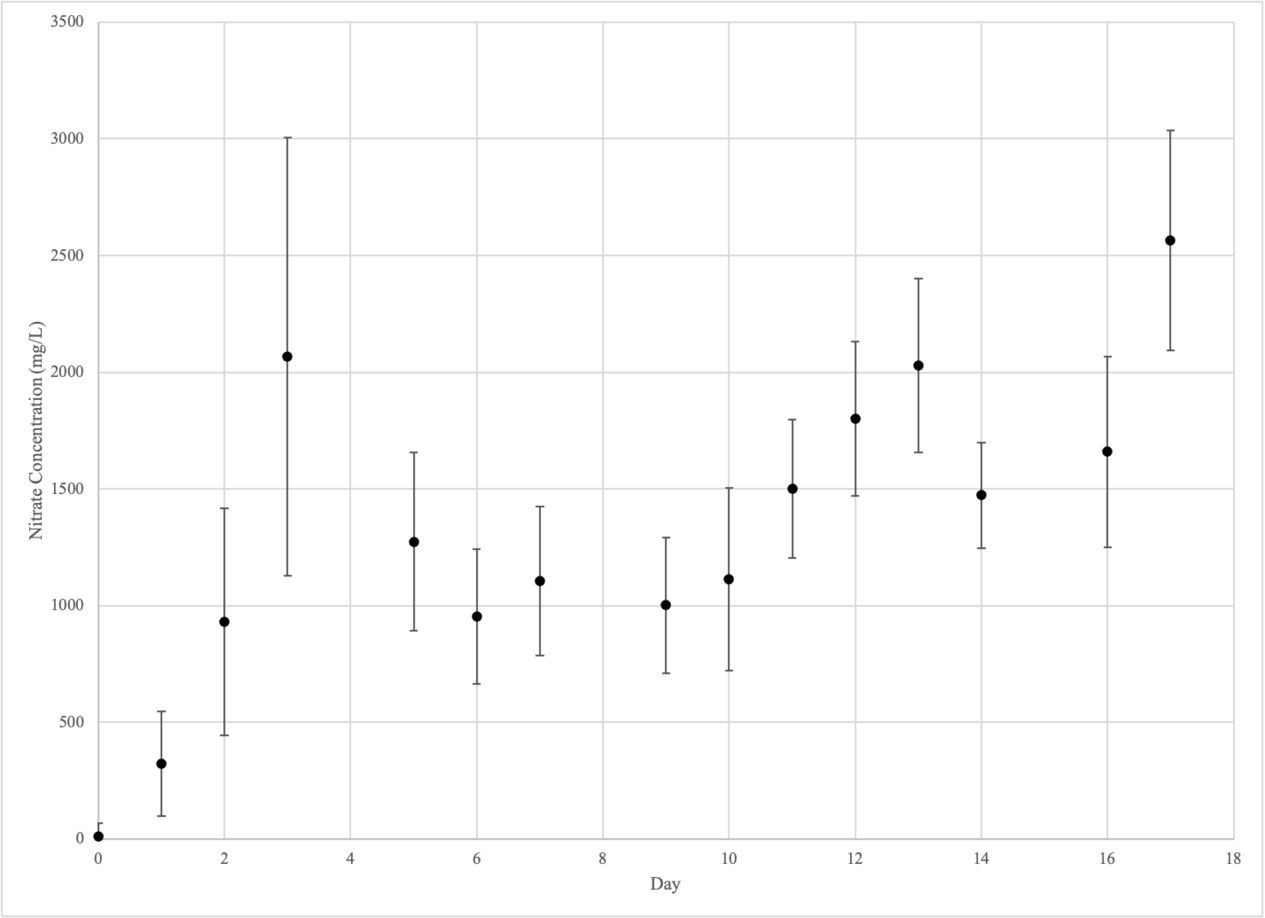
| NITRATE (mg/L) | |||||||||
| CONTROL GROUP | EXPERIMENTAL GROUP 1 | EXPERIMENTAL GROUP 2 | |||||||
| DAY | #1 | #2 | #3 | #4 | #5 | #6 | #7 | #8 | #9 |
| 0 | 10.96 | 10.96 | 10.96 | 10.96 | 10.96 | 10.96 | 10.96 | 10.96 | 10.96 |
| 1 | 24.19 | 36.10 | 58.47 | 128.52 | 1110.63 | 245.09 | 134.29 | 659.53 | 175.09 |
| 2 | 371.42 | 538.86 | 316.17 | 6309.27 | 14986.5 | 5565.38 | 554.03 | 1788.36 | 451.54 |
| 3 | 150.52 | 116.74 | 145.16 | 18257.10 | 20856.57 | 16876.04 | 2434.34 | 3375.06 | 389.19 |
| 4 | - | - | - | - | - | - | - | - | - |
| 5 | 483.06 | 638.54 | 489.13 | 3471.74 | 3982.56 | 5721.75 | 1685.71 | 1502.80 | 633.25 |
| 6 | 670.05 | 775.33 | 866.40 | 4625.33 | 4645.53 | 4175.80 | 1222.31 | 1147.50 | 490.73 |
| 7 | 793.97 | 738.87 | 693.84 | 5698.18 | 5144.28 | 4516.49 | 1380.48 | 1351.91 | 582.86 |
| 8 | - | - | - | - | - | - | - | - | - |
| 9 | 579.19 | 531.88 | 710.11 | 18009.71 | 7646.28 | 5907.93 | 1156.46 | 1308.95 | 538.78 |
| 10 | 593.96 | 542.22 | 633.89 | 16779.89 | 5748.03 | 5942.10 | 973.81 | 1748.80 | 614.40 |
| 11 | 655.16 | 504.26 | 610.03 | 12096.73 | 8158.29 | 9736.11 | 1475.04 | 1926.45 | 1099.94 |
| 12 | 710.34 | 590.02 | 749.03 | 14668.27 | 6534.29 | 8450.57 | 1863.58 | 2238.87 | 1300.14 |
| 13 | 720.56 | 670.40 | 853.24 | 15980.77 | 6680.48 | 7680.40 | 2250.65 | 2430.82 | 1405.88 |
| 14 | 717.63 | 525.88 | 576.93 | 18775.95 | 6660.85 | 9290.14 | 1573.98 | 1703.52 | 1140.89 |
| 15 | - | - | - | - | - | - | - | - | - |
| 16 | 706.48 | 525.88 | 654.66 | 19534.33 | 6570.42 | 8046.78 | 1855.30 | 2145.23 | 976.22 |
| 17 | 720.70 | 523.02 | 675.14 | - | 17318.29 | 23793.05 | 2477.82 | 3324.31 | 1896.88 |
Graphical Analysis
Ammonium
Control Group (Beakers 1-3)
Experimental Group 1
Experimental Group 2
Nitrate
Control Group (Beakers 1-3)
Experimental Group 1 (Beakers 4-6)
Experimental Group 2 (Beakers 7-9)
Annotated Bibliography
- “BIO-Spira® for Safely Treating Aquarium Water from Instant Ocean®.” Instant Ocean, www.instantocean.com/Products/aquarium-saltwater-care/salt-water-set-up/bio-spira-saltwater-aquarium-bacteria.aspx.
- Bio-Spira is mainly for maintaining the nitrification process in aquariums. Marine Bio-Spira contains a patented mix of nitrococcus, nitrosomonas, nitrosospira and nitrospira. These are the bacteria we are working with.
- Daims, Holger et al. “A New Perspective on Microbes Formerly Known as nitrite-oxidizing Bacteria.” Trends in microbiology vol. 24,9 (2016): 699-712. doi:10.1016/j.tim.2016.05.004
- The main issue is nitrification reduction which occurs when no more ammonia is present. Nitrobacter participates in dissimilatory nitrate reduction in anaerobic conditions. Ammonia is an inhibiting factor for nitrate reduction. Another key takeaway is the types of nitrifying bacteria: AOB (Ammonia Oxidizing Bacteria), NOB (Nitrite-oxidizing Bacteria), and Comammox (Complete Ammonia Oxidizer).
- Ghaly, A E. “Nitrification of Urea and Assimilation of Nitrate in Saturated Soils under Aerobic Conditions.” ResearchGate, American Journal of Agricultural and Biological Science 8(4):330-342, Apr. 2013, 10.3844/ajabssp.2013.330.342.
- The nitrification cycle has different rates of conversion for NH4+ to NO2- and NO2- to NO3- depending on the time of the trial. NH4+ to NO2- is the primary step and has a duration of the first twelve days, whereas NO2- to NO3- is the second step and expires around 23 days.
- Hemmeryckx, B., Bauters, D., & Roger, H. (2017). UCP-1 (Abcam ab10983) immunohistochemical protocol v1 (protocols.io.j9scr6e). Protocols.io. doi: 10.17504/protocols.io.j9scr6e
- The antibodies are chemically labeled with a fluorescent dye through covalently bonding with primary antibodies (Direct IF) or through bounding with a secondary antibody labeled with dye (Indirect IF). Under a light microscope, the fluorophores will be visible with distinct emission spectra.
- Holger Daims, Michael Wagner. “Nitrospira, Trends in Microbiology.” Volume 26, Issue 5, 2018, Pages 462-463, ISSN 0966-842X, https://doi.org/10.1016/j.tim.2018.02.001 (http://www.sciencedirect.com/science/article/pii/S0966842X18300246)
- Looking at Nitrospira, it is a nitrite-oxidizing bacteria that rely on aerobic conditions and nutrients from ammonium-oxidizing bacteria. This is a key source for Nitrospira metabolism.
- Kim, Dong-Jin, et al. “Effect of Temperature and Free Ammonia on Nitrification and Nitrite Accumulation in Landfill Leachate and Analysis of Its Nitrifying Bacterial Community by FISH.” Bioresource Technology, Elsevier, 31 May 2005, www.sciencedirect.com/science/article/abs/pii/S096085240500180X.
- Finding the amount of nitrifying bacteria using the fluorescence in situ hybridization method.
- Liu, Lingyan, et al. “Quantitative Analysis of Urea in Human Urine and Serum by 1H Nuclear Magnetic Resonance.” The Analyst, U.S. National Library of Medicine, 7 Feb. 2012, www.ncbi.nlm.nih.gov/pmc/articles/PMC4758351/.
- Research paper for finding urea concentrations using NMR measurement. They used synthetic urea aqueous solutions and a sample from a healthy make adult. We can use this paper as a reference when we are finding the urea concentration of our samples using NMR.
- Yao, Q., & Peng, D.-C. (2017). Nitrite oxidizing bacteria (NOB) dominating the nitrifying community in full-scale biological nutrient removal wastewater treatment plants. AMB Express, 7(1). doi: 10.1186/s13568-017-0328-y
- Five serotypes that correlate with the Nitrobacter: AG, DE30, W (N. winogradskyi), LL, & X14 (N. hamburgensis). The serotypes require an Indirect IF method using antibodies from New Zealand rabbits whose blood was immunized with the serotypes. 12-wells microplates of an IF slide containing 20 microL of samples are dried in a sterile hood. “Enumeration was performed at 1000 x magnification using a Nikon Labophot epifluorescence immersion microscope fitted with an HBO-100 W mercury lamp.”
Team Members
| Name | Email Address | Major | Years |
|---|---|---|---|
| Aravind Ganesan | aravindgan@gatech.edu | Environmental Engineering | 2019 - Current |
| Alison Thompson | athompson302@gatech.edu | Environmental Engineering | 2019 - Current |
| Maria Cardelino | mcardelino3@gatech.edu | Environmental Engineering | 2020 - 2021 |
| Shalini Udawatte | sudawatte3@gatech.edu | Chemistry | 2021 |
| Trevor Morelock | tmorelock3@gatech.edu | Biochemistry | 2020 - 2020 |
| Michelle Zheng | mzheng48@gatech.edu | Civil Engineering | 2019 - 2020 |
| Emily Tribby | etribby3@gatech.edu | Earth and Atmospheric Sciences | 2021 - Current |
| Sam Auborn | sauborn3@gatech.edu | Chemical and Biomolecular Engineering | 2021 - Current |
| Emily Hang | ehang3@gatech.edu | Biology | 2021 - Current |
| Abigail Willis | awillis40@gatech.edu | Environmental Engineering | 2021 - Current |
| Alyssa Lawji | alawji3@gatech.edu | Chemical Engineering | 2021 - Current |
| Matthew Ennis | mennis8@gatech.edu | Environmental Engineering | 2021 - Current |
Updates
Lab Notebook
Access our Liquid Waste Nitrification Lab Notebook < Notebook >
Fall 2020
Fall 2020 Poster Presentation < Poster >
WK14: Project Update < slides >
WK13: Project Update < slides >
WK11: Project Update < slides >
WK10: Project Update < slides >
WK9: Project Update < slides >
WK8: Project Update < slides >
WK7: Project Update < slides >
WK5: Project Update < slides >
WK4: Project Update < slides >
WK3: Project Update < slides >
WK2: Project Update < slides >
WK1: Semester Goal < slides >
Spring 2020
Spring 2020 Poster Presentation < poster >
WK13 Project Update 7 < slides >
WK12 Project Update 6 < slides >
WK11 Project Update 5 (Distance Learning) < slides >
WK8: Project Update 4 < slides >
WK5: Project Update 3 < slides >
WK4: Project Update 2 < slides >
WK3: Project Update 1 < slides >
WK2: Project Proposal < slides >
Spring 2021
Spring 2021 Poster Presentation < poster >
WK14 Project Update 6 < slides >
WK12 Project Update 5 < slides >
WK10: Project Update 4 < slides >
WK8: Project Update 3 < slides >
WK6: Project Update 2 < slides >
WK4: Project Update 1 < slides >
WK2: Project Proposal < slides >
Fall 2021
WK12 Project Update 5 < slides >
WK10: Project Update 4 < slides >
WK8: Project Update 3 < slides >
WK6: Project Update 2 < slides >
WK4: Project Update 1 < slides >
WK2: Project Proposal < slides >


