Soils
From Living Building Science
Contents
Spring 2022
Purpose of Study
In this study, we will examine how soil chemical and microbial composition in Eco-Commons today compares to historic Piedmont soils and traditionally “healthy” soils, and how we can restore soil health and promote soil carbon sequestration in this region. Our goals for the semester included:
- Examining the difference in chemical composition between unscraped and scraped soil regions in the Eco-Commons to understand the current state of soil health in disturbed and undisturbed soil regions.
Our long-term goals include:
- Analyzing the current state of soil health in the Eco-Commons.
- Addressing soil composition deficiencies to restore soil to a historic baseline.
- Establishing protocols and infrastructure that could be utilized for long-term monitoring of soil on campus.
Background
The 8-acre Eco-Commons green restoration area was completed and officially opened to the Georgia Tech community in early 2021. As a part of fulfilling the Place Petal for the Kendeda Building for Innovative Sustainable Design, the landscaping is meant to mimic the functionality of the reference ecosystem as it matures. However, due to the prior history of the area as well as the construction of the Eco-Commons, a significant amount of the native soil has been frequently displaced and disturbed over time. In order to restore proper ecosystem functioning in accordance with the requirements established by the Place Petal, an assessment of soil health is needed. Among other indicators, healthy soils are key to promoting that proper functioning and could assist with the establishment of healthy plant communities throughout the Eco-Commons. By analyzing the microbial diversity and geochemical properties of the Eco-Commons and comparing it to more “old growth” Piedmont areas, we hope to assess and potentially improve soil health to promote proper ecosystem functioning in the Eco-Commons, as well as support biodiversity on a micro and macro scale.
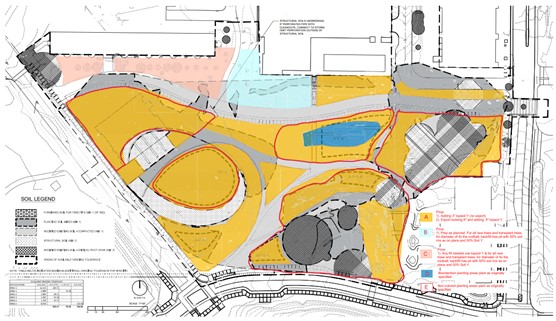
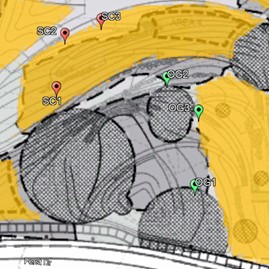
Before the construction of the Eco-Commons, the land it is now built upon used to hold the Georgia Tech Police Station as well as various roads and parking lots. These structures were all demolished and work was done throughout 2019 and 2020 to achieve the state the Eco-Commons is in now. To begin, 10” of topsoil throughout the Eco-Commons was cleared away (Yellow areas in Fig. 1) to ameliorate the high pH of the soil (~6.5+), except in areas where old-growth trees persisted on the existing ridgeline (Grey areas in Fig. 1). Then, the subgrade was scarified, sulfate was added to lower the pH, and bark mulch was ripped into the soil to loosen it. More topsoil and 4 inches of compost were then added to both the untouched ridgelines and the cleared areas, and all the soil was tilled together. Part of the management plan currently includes returning fallen leaves and other plant matter to the landscaping after shredding and composting to assist with soil health. Otherwise, no fertilizers or herbicides are used throughout the Eco-Commons.
In addition to changes in the soil, almost all plants in the Eco-Commons were either seeded in or planted as seedlings, with some plants replaced periodically according to their warranties. Although much is known about soil treatments and landscaping, little work has been done to characterize the microbial community present in the Eco-Commons.
Methodology
I. Materials
- Curly stakes/landscaping stakes
- Tape measure
- 1 m string
- Paper bags – for collecting soil samples initially
- Ziploc bags – for storing soil samples in freezer (make sure they are well labelled)
- Soil corer
- Polyvinyl chloride (PVC) pipe
- GNSS device
- Nitrile gloves
- Ethanol (70%, 80%)
- Paper towels
- Bucket
- Scrub brush for cleaning between samples
- Cooler and freezer packs
- Alconox soap
II. Sampling Preparation
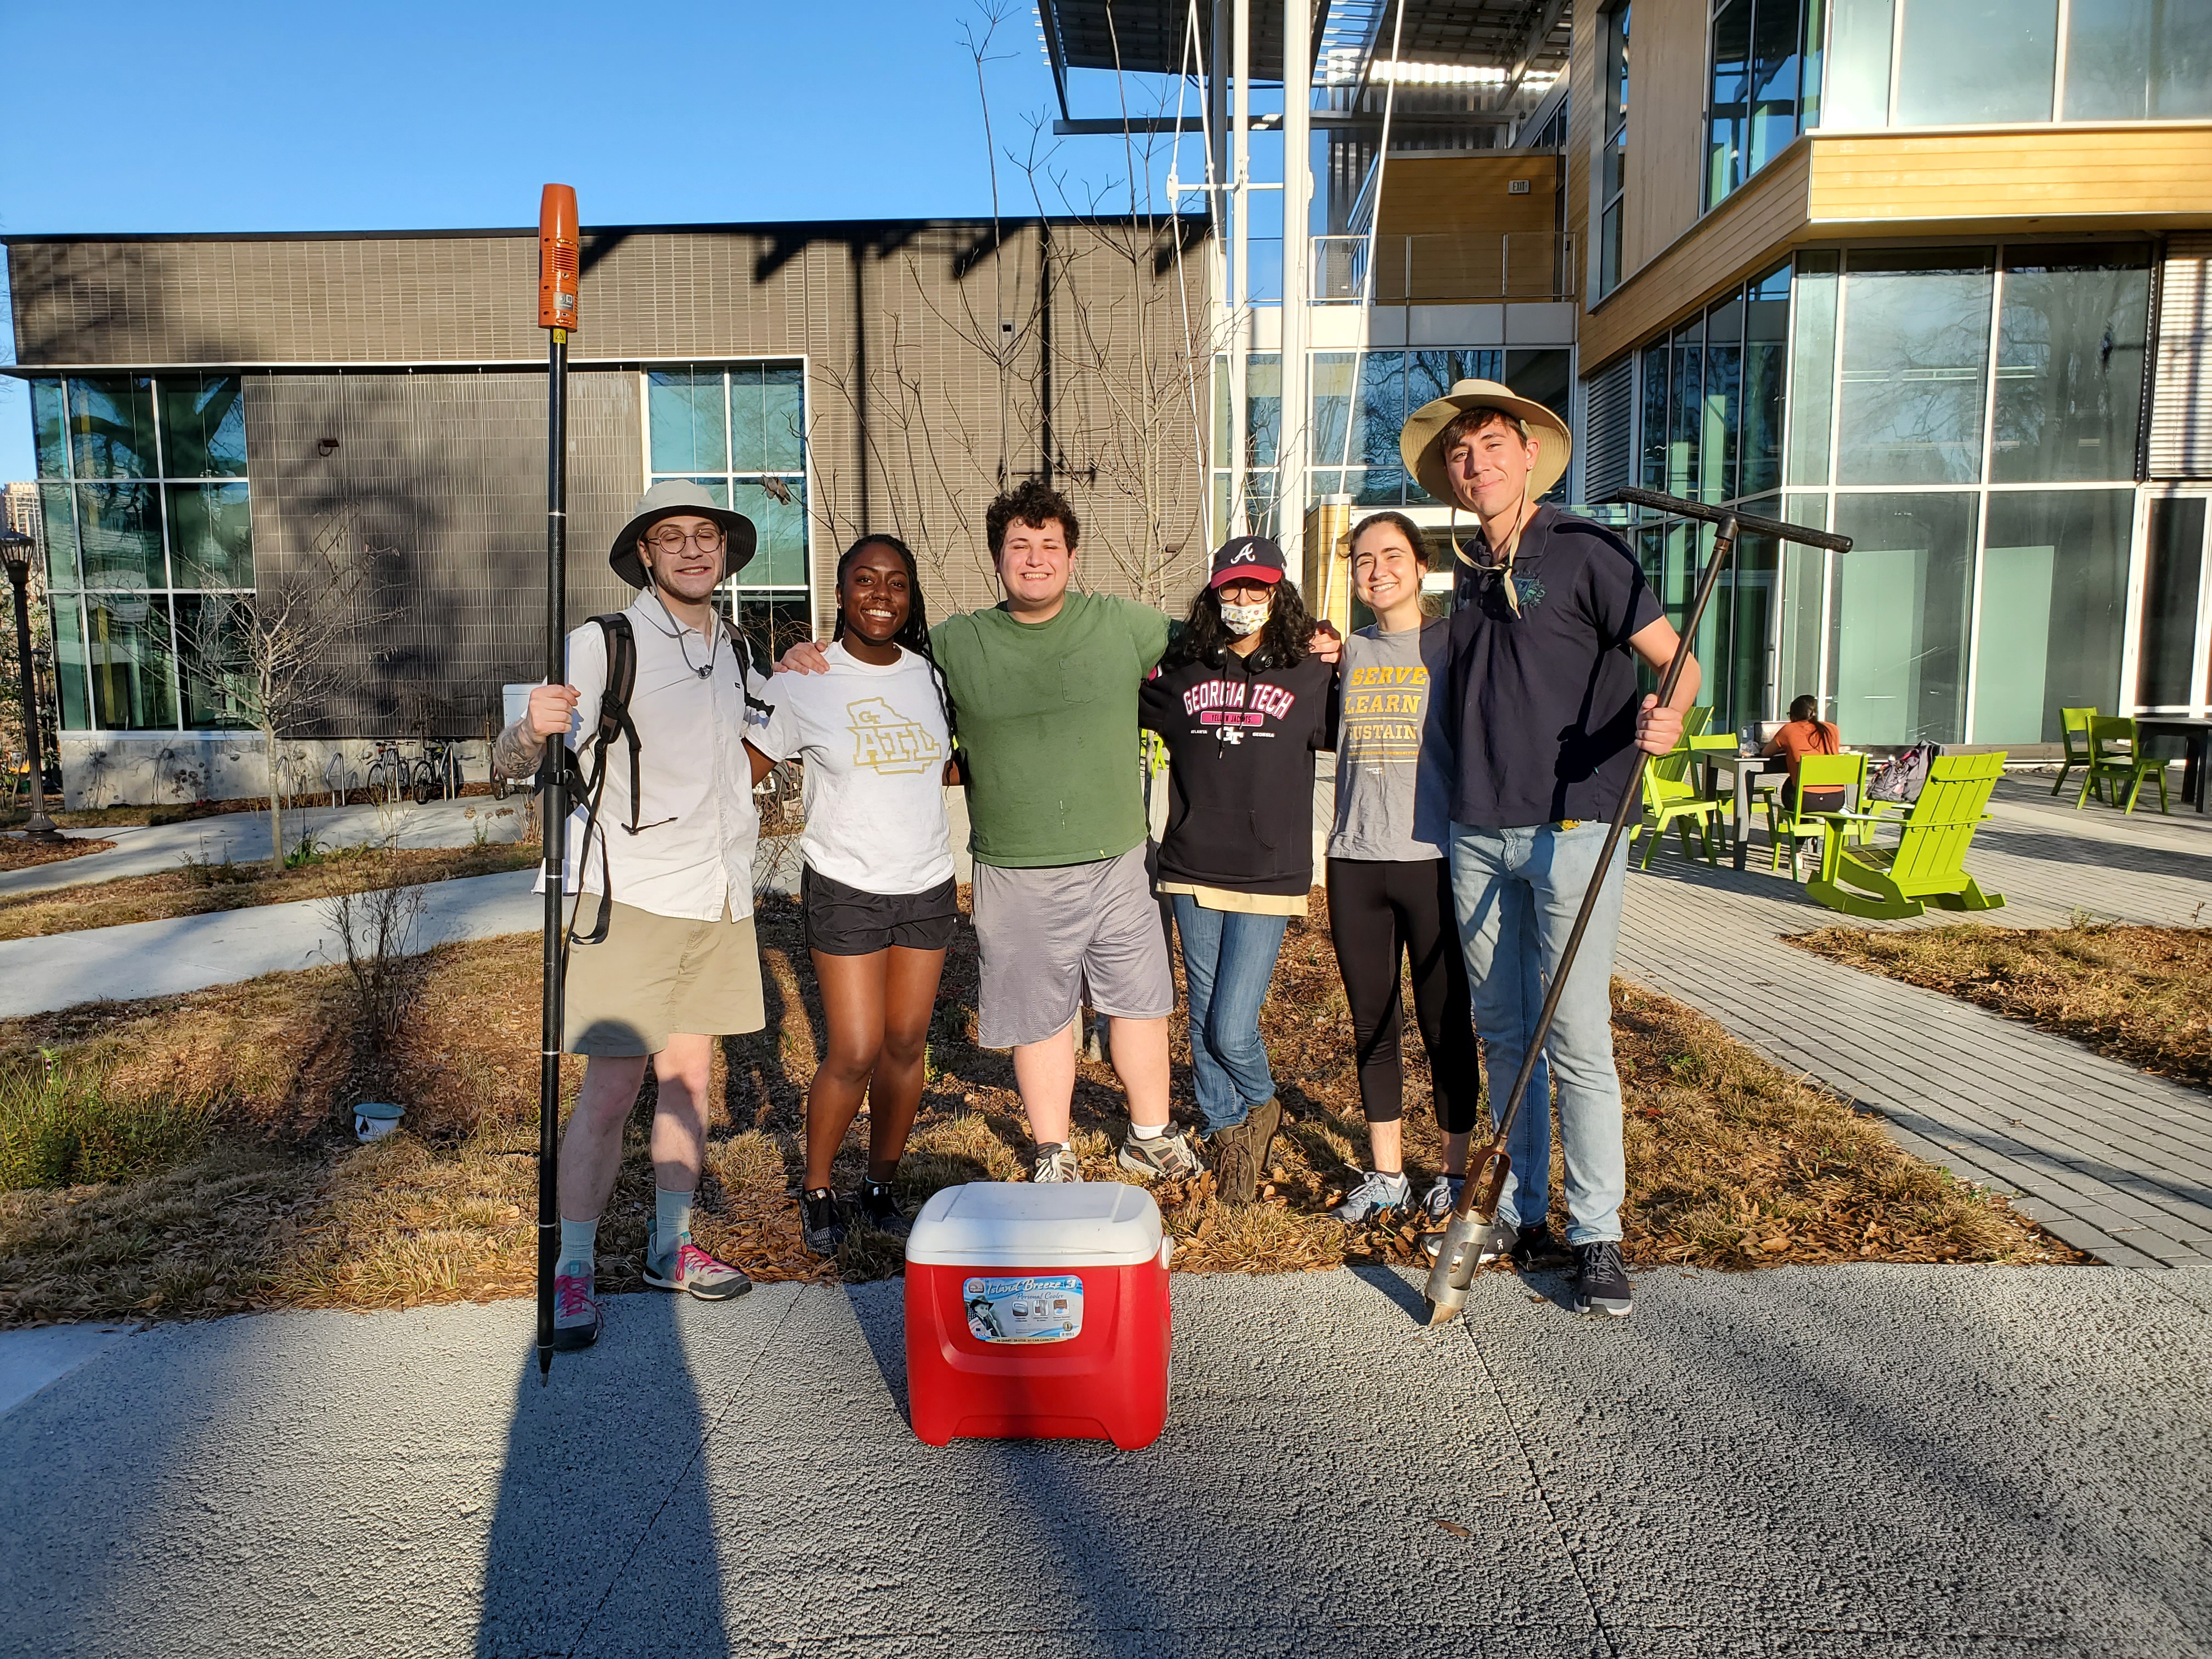
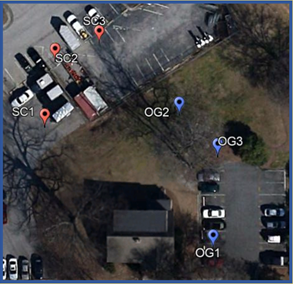
One of the primary Piedmont regions in the Eco-Commons was selected for analysis this semester. To accurately account for differences in soil composition as a a result of construction practices, the sampling points were selected from two different areas within the region, with areas retaining the original soil labelled as “original” (OG; areas marked in grey on Fig. 1) and those where the top 10” of soil were scraped away labelled as “scraped” (SC; areas marked yellow on Fig. 1). Within each area of either OG or US soils, ten sample sites were randomly selected by approximating photographed construction patterns in Google Earth (Fig. 2), with sites only being selected if they were approximately 10 meters away from another. If a site was within 10 meters of another site, it was excluded and a new random point was selected.
III. Field Sampling
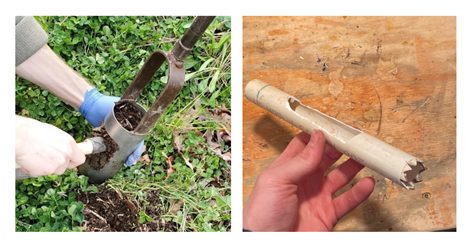
Using a GPS unit, we located the randomly selected points in the Eco-Commons and placed a thin metal stake at the GPS point. Using a 3.5” soil corer, we collected four cores within one meter of the GPS point in each of the cardinal directions using a pre-measure string to mark the appropriate distance. Smaller samples were collected from each layer of the larger core with a prepared PVC pipe punch out (Fig. 3), and placing approximately three fl. oz of well mixed soil from each core into plastic bags (total 12 fl. oz for each composite). Water was used to rinse the corer between each sample and ethanol was used to rinse the corer between sampling sites; all core cleaning was completed with gloves. Bags were then labelled and put on ice until they could be stored at –20 C in the Kendeda Building freezer. When randomly selected sample sites proved inaccessible for some reason (i.e. the presence of a physical structure, a rock, sidewalk, etc), then another site was randomly selected from the pool of additional points using a random number generator.
| Sample Label | Site Number | Coordinates |
|---|---|---|
| OG1 | US3 | 33.7786669 N, 84.4002488 W |
| OG2 | US5 | 33.7789256 N, 84.4003249 W |
| OG3 | US6 | 33.7788436 N, 84.4002357 W |
| SC1 | S2 | 33.7789030 N, 84.4006469 W |
| SC2 | S6 | 33.7790351 N, 84.4006232 W |
| SC3 | S1 | 33.7790714 N, 84.4005164 W |
IV. Sample Drying
Samples were air dried on 18 March 2022 in Room 2-66 at the Gilbert Hillhouse Boggs Building. Counter tops were first cleaned with 70% ethanol. Container lids were subsequently cleaned using the cleaning procedure below:
- Rinse with 70% ethanol
- Rinse MiliQ water
- Scrub with Alconox soap
- Rinse with MiliQ water
- Rinse with 70% ethanol
Following one hour of air drying, tape was used to visually separate the container lid into two sides and paper towels were added to the container lids to hold the soil on top of the container. Soil samples were then added to the paper towels and roots and stones were removed as recommended by Cong et al. 2015. After air drying for three days, soil samples were prepared for geochemical analyses.
V. Geochemical Analysis
Soil samples were packaged and delivered to the University of Georgia Cooperative Extension for an extensive geochemical analysis by the UGA Soil, Plant, and Water Laboratory. Each bagged sample was brought to the county UGA extension office and submitted, along with the corresponding submission forms that include address, plant grown in the soil, sample numbers, and county code. For shipping efficiency, the bags were assorted into soil sample shipping boxes at the office. The corresponding soil analysis included a routine test (testing for soil pH, lime, extractable Phosphorus, Potassium, Calcium, Magnesium, Manganese, and Zinc) and a more advanced test (testing for Sodium, Iron, Copper, Chromium, Molybdenum, Nickel, Cadmium, Lead, cation exchange capacity, and percent base saturation).
Once received, results of nutrient density were converted from units of pounds per acre to milligrams per kilogram. According to the University of Florida IFAS Extension, we can convert from pounds per acre to ppm by multiplying the pounds per acre value by a factor of 0.5. This conversion is based on two assumptions: that the root depth / sampling depth is 6 inches, and that the nutrients are in elemental form. Both these assumptions are satisfied based on our sampling procedure and the UGA extension soil test results. Additionally, according to Kansas State University, 1 ppm of a nutrient/contaminant in soil is equal to 1 mg/kg of the contaminant.
This data was then analyzed using a student's T-test.
Results
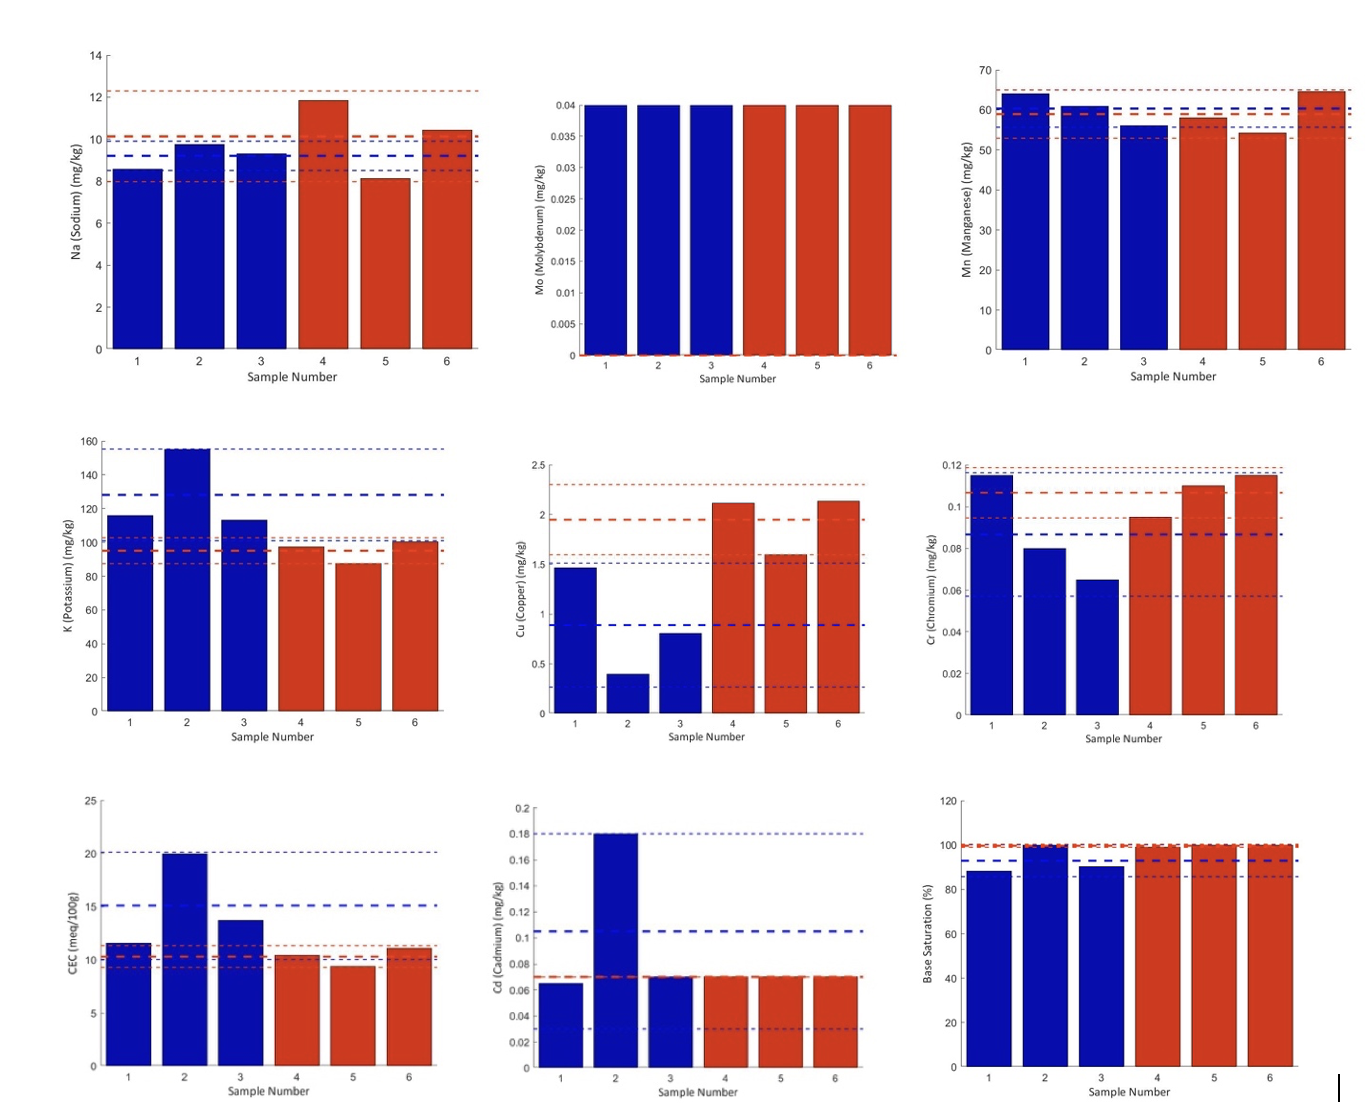
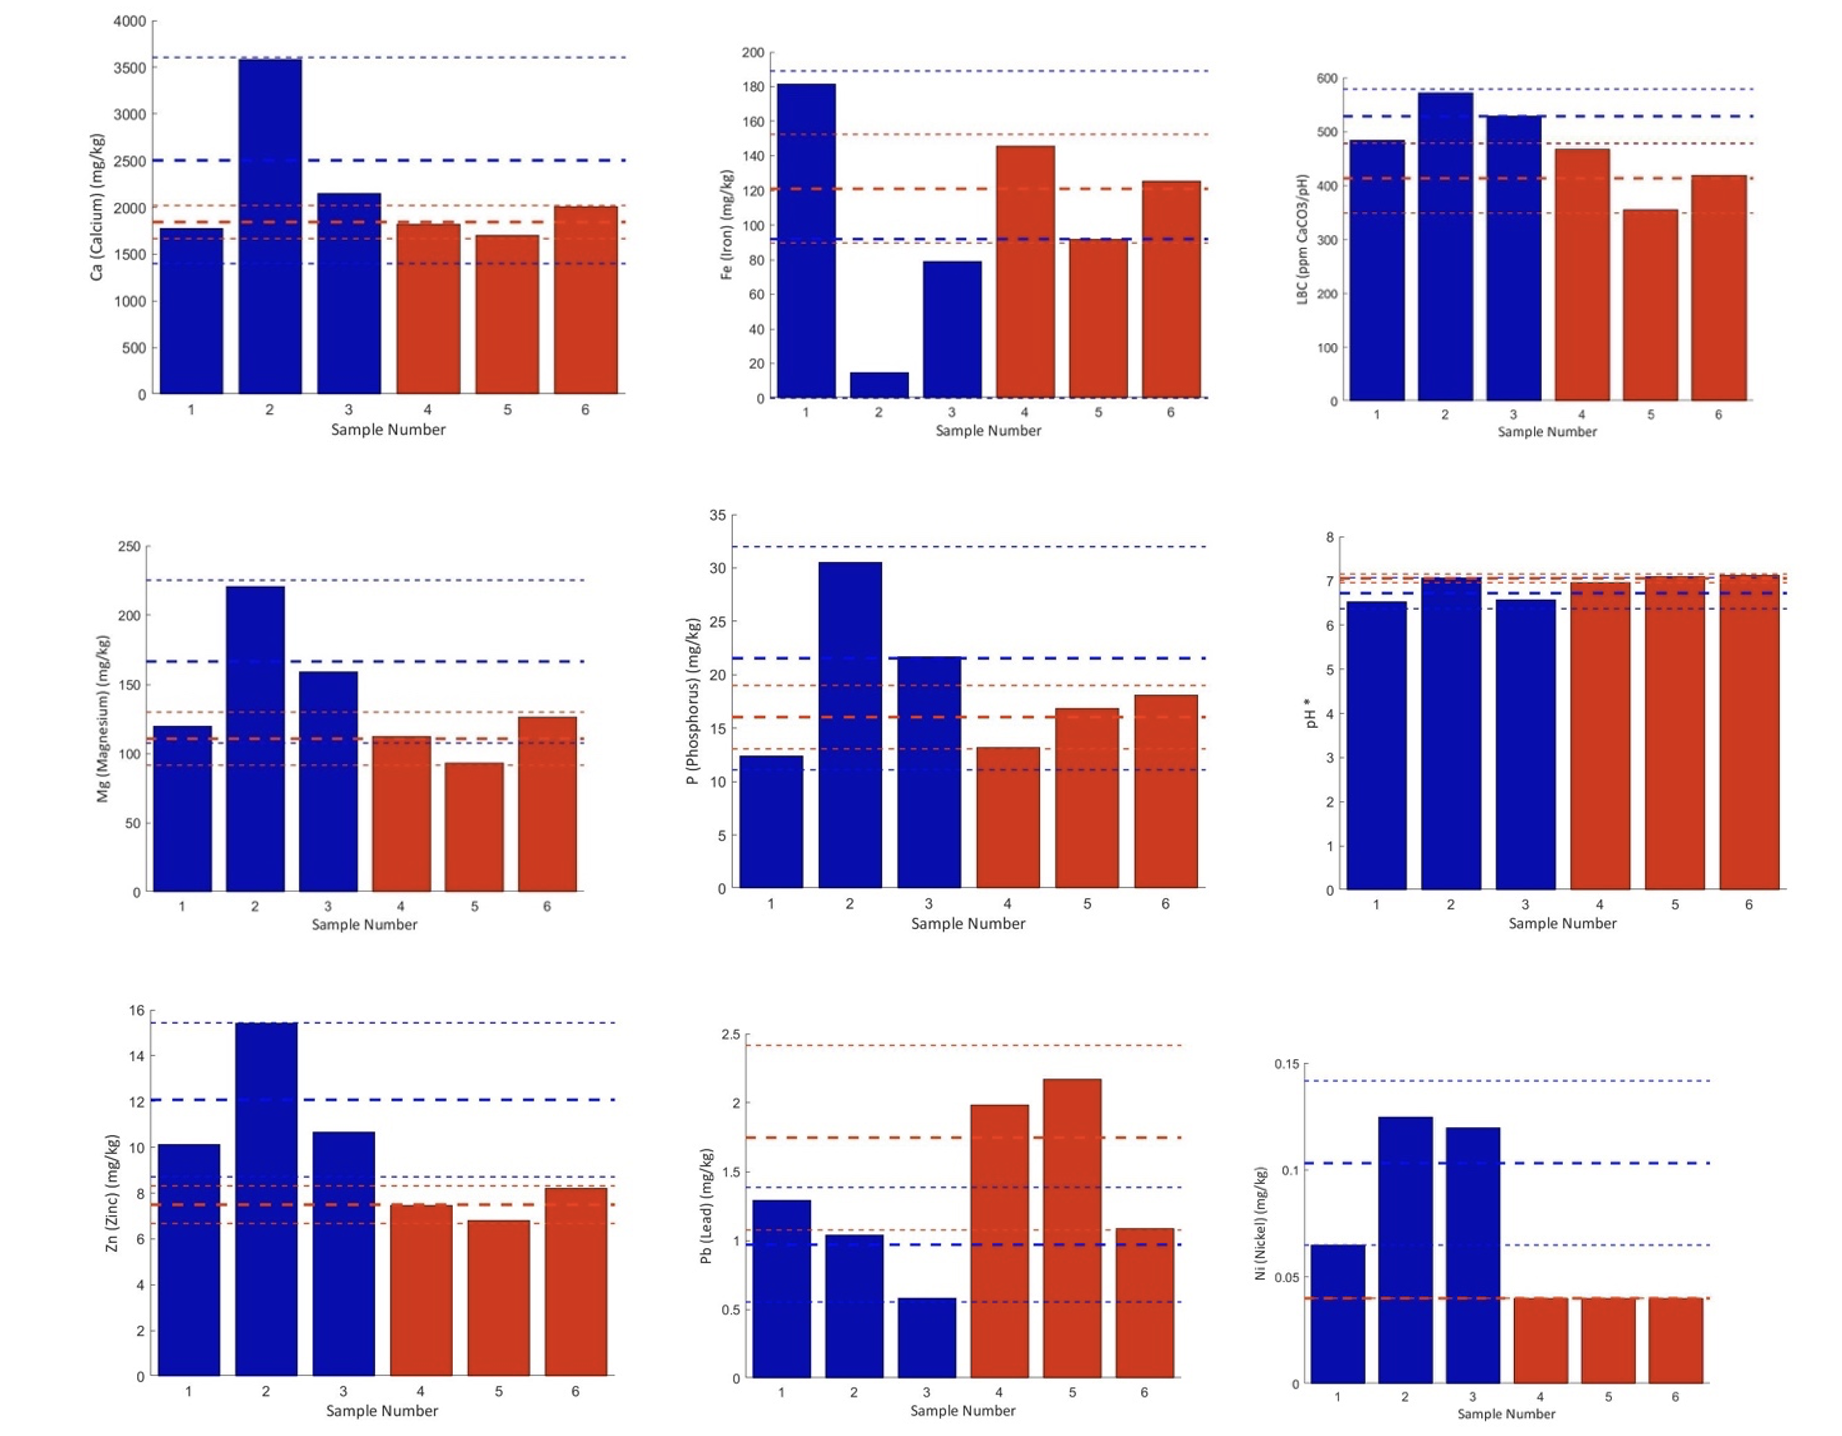
On the x-axis of each plot:
- Samples 1, 2, and 3 = samples OG1, OG2, and OG3
- Samples 4, 5, and 6 = samples SC1, SC2, and SC3
In addition to relevant elemental concentrations, we measured three key measures of soil geochemistry:
- pH - The measure of acidity.
- CEC (Cation Exchange Capacity) - The total negative charge available to adsorb nutrient cations (K+, Mg2+, Ca2+) in the soil.
- LBC (Lime Buffer Capacity) - The amount of soil acidity that must be neutralized to raise soil pH by one unit.
Discussion
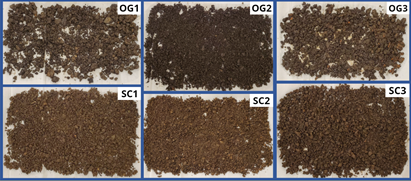
We found a significant difference in the mean LBC values between the scraped and unscraped groups (using a t-test), but for none other testable variables. However, this could be a result of our small sample size, in addition to low concentrations of specific elements, such as Molybdenum and Nickel which were too low to determine confidently. When looking at the results, it's clear that OG2 is an outlier within the unscraped samples and within the samples as a whole. Even upon visual inspection, OG2 was slightly darker and had a different texture. The most marked differences were comparatively lower iron (Fe) and copper (Cu) concentrations, and higher phosphorous (P), magnesium (Mg), and calcium (Ca) concentrations. Except for iron, each of these indicators seems to point toward a higher organic matter content; however, we still need to complete an organic matter analysis to know for certain. The incongruity of OG2 may be explained by taking a closer look at the historical landscape of the Eco-Commons area as shown in Figure 5. When the area was still a parking lot, we intended for OG sites 1-3 to lie in the minimally disturbed green area; however, OG1 was originally in the asphalt area and OG3 was along the border between the asphalt and green area. Therefore, it is possible that only OG2 was a true "unscraped" site or was subject to a different remediation protocol. The comparative iron deficiency at OG2 is somewhat more difficult to explain but may be caused by the elevated phosphorus and zinc.
Below are a few sources of error that we identified through testing our procedures:
- The core was slightly rusty due to past use, so we opted to use a PVC punch-out tool (Fig. 2) to collect soil from within the core while avoiding contact with the metal. This lacked precision, possibly resulting in an uneven distribution of the soil layers.
- Each sample contained the minimum required amount of soil as designated by the UGA Extension Service. As such, we could not sort some organic matter (roots, debris, etc.) and larger sediments out of the samples before analysis.
Many of our randomly distributed sampling sites were inaccessible for sampling, resulting in a few of the sites being clustered together.
Future Work
Moving forward, we plan to achieve our objective of measuring the current soil health of the Eco-Commons by:
- Collecting another round of soil samples that will be used for both geochemical and biological analysis.
- Conducting plant surveys around sampling points to analyze the relationship between soil communities and plant communities.
- Developing a sustainable methodology to conduct geochemical analyses on-campus and comparing the accuracy of those results with the UGA extension services.
We will also conduct activities aimed at restoring and preserving the soil health in the long term by:
- Comparing our results to a less disturbed Piedmont environment and devising proposals for potential soil amendments to help the Eco-Commons soils reach desired goals.
- Establishing long-term protocols to monitor changes in soil health either through the VIP program or through relevant labs on campus.
The Team!
| Name | Major | Years Active |
|---|---|---|
| Ally Kimpling | Biology | Spring 2022 |
| Thiago Esslinger | Biochemistry / Earth & Atmospheric Sciences | Spring 2022 |
| Ethan Losasso | Earth & Atmospheric Sciences | Spring 2022 |
| Alex Kovensky | Biology | Spring 2022 |
| Dormecia Allen | Chemical Engineering | Spring 2022 |
| Amy Siddiqui | Environmental Engineering | Spring 2022 |
References
Woltz, N.B.. (2019, May 22). DESIGN DEVELOPMENT SUBMITTAL [blueprint]. Barge Design Solutions (3809900). Eco-Commons Living Building Sector - BR-30-1803, Atlanta, Georgia. (Fig. 1)
Plank, O. (2014, November 1). Soil Testing for Home Lawns, Gardens and Wildlife Food Plots. University of Georgia Extension. Retrieved April 24, 2022, from https:/extension.uga.edu/publications/detail.html?number=C896&title=Soil+Testing+for+Home+Lawns%2C+Gardens+and+Wildlife+Food+Plots
Google Earth version 7.3.4.8573 (64-bit). (February, 2013). Atlanta, Georgia 30332.
Cong, J., Yang, Y., Liu, X., Lu, H., Liu, X., Zhou, J., Li, D., Yin, H., Ding, J., & Zhang, Y. (2015, May 6). Analyses of soil microbial community compositions and functional genes reveal potential consequences of natural forest succession. Nature News. Retrieved May 1, 2022, from https://www.nature.com/articles/srep10007

