Machine Learning
From Living Building Science
Welcome to the Machine Learning Team Page! Our main goal is using machine learning and analysis tools to assist researchers from different disciplines in their studies about bees (Bee Snap team) and sustainable constructions (Living Building Science team).
Some highlights of our work:
- Perform data analysis on drone data (in-progress).
- Find relationships between drone behavior and weather patterns (in-progress).
- Develop an image classification model to detect varroa mites on honeybees (in-progress).
- Developed models to classify flowers and bees, which are to be used in the game app BeeKeeper GO (another project within the Bee Snap space).
- Applied data analysis and computer vision to detect the occurrence of swarms in bee hives and the contributing factors/warning signs that will lead to a swarm occurring.
- Developed bird image & sound classification models, which are to be integrated with an ongoing project owned by the Biodiversity team.
Contents
Flower and Bee Classification
[Fall 2020 - Spring 2021]
We developed flower and bee classification models which will be integrated into the BeeKeeper GO app. Our models could potentially be used to enhance the experience of the app and make it more educational for users by allowing users to learn more about local flowers and bees while taking pictures.
Methods
Data
Datasets are collected from:
- https://www.kaggle.com/alxmamaev/flowers-recognition
- https://www.kaggle.com/rednivrug/flower-recognition-he#18547.jpg
- https://www.flickr.com/services/api/
- https://www.inaturalist.org/
Models
This is a Convolutional Neural Network (CNN) model, and we developed it using Keras API and Tensorflow framework. Currently, this model will be focused to recognize flowers that are native to Atlanta such as daffodils, dandelions, azaleas, and magnolias. Some image preprocessing techniques used are: Gaussian Blurring, Image Segmentation, Edge Detection, and Color Inversion.
The bee model also follows the CNN architecture. Addition image preprocessing techniques and different layer applications were attempted to improve the performance of the bee model. The exported trained models was integrated into the API to make predictions along with corresponding confidence level.
The current plan is to use this confidence level not only to classify flower and/or bee species, but also to determine whether an image contains a bee and/or flower if the confidence level is below a certain threshold. To achieve this, the input image will be passed into the flower model and bee model separately.
Results
The flower and bee models have 86% and 92% accuracy, respectively. However, the bee model does have overfitting that needs to be resolved.
The challenge found in the current bee model is that it can accurately classify honeybee and bumble bee only (2 out of 7 species) despite the high accuracy in assessment after the training.
Future Work
Overfitting in the bee model could be further reduced by combining predictions from multiple models (Ensemble Learning Methods for Deep Learning Neural Networks).
Some research was done to find alternative approaches to combine the flower and bee models, one of which is to create a new model implementing object detection using Mask R-CNN. This model is capable of detecting multiple objects (flowers and bees in this case) in one image and displaying confidence score for each object.
Hive Analysis
[Fall 2020 - Spring 2021]
Initially, we created a script and tracking algorithm to draw the paths of bee flight in a given video. In order to use this data to forecast bee swarming, we modified this algorithm to track the distance traveled by each bee in each frame and appended that to a CSV file. This CSV file is to be used as a feature to analyze the bee movements on campus and determine their relative speeds and active points. We decided not to further improve this CSV tracking after we decided to cut down on the projects this semester.
GitHub Repo: Hive Analysis
Swarm Time Series Analysis
[Spring 2021]
We developed three primary models, ARIMA, ARIMAX, and SARIMAX, in order to make predictions on future hive weights based on current hive weight data.
Methods
ARIMA is a type of time series model that stands for Auto-Regressive Integrated Moving Average. ARIMA is commonly used for time series analysis because it is good at using information in the past lagged values of a time series (which is simply data mapped over time) to predict future values. As the name implies, the model consists of three primary components. The first component, the Auto-Regressive (AR) component, involves regressing the time series data onto a previous version of itself using lags, or prior values. The AR component is measured by a parameter p, which is the number of lag observations in the model. The second component, the Integrated (I) component, involves differencing the raw data in order to make the time series stationary. A time series is stationary if there are no trend or seasonal effects, and the overall statistical properties (such as mean and variance) are constant over time. The I component is measured by a parameter d, which is the number of times raw observations need to be differenced to become stationary. The final component, the Moving Average (MA) component, involves using the previous lagged errors to model the current error of the time series. The MA component is measured by a parameter q, which is the size of the moving average window.
Each ARIMA model is uniquely determined by its p, d, and q values. In order to determine which ARIMA (p, d, q) is best for forecasting hive weights using our data, we conducted various statistical tests such as the Ad-fuller (ADF) test and we observed various plots such as the auto-correlation (ACF) and partial auto-correlation (PACF) plots.
In addition to ARIMA, we also used two additional models, ARIMAX and SARIMAX, to forecast hive weights. Both ARIMAX and SARIMAX involve using exogenous (X) variables, which are essentially other variables in the time series that may be used to assist in forecasting the original variable. For our exogenous variables, we used hive temperature, hive humidity, ambient temperature, ambient humidity, and ambient rain. SARIMAX differs from ARIMAX in the sense that it takes seasonality (S) into account, as it is often used on datasets that have seasonal cycles.
Results
After forecasting hive weights using our three models, we analyzed the error for all three sets of predictions using Mean Absolute Percentage Error (MAPE). We used MAPE as our error metric because it is fairly intuitive in the sense that it is simply an averaged measure of the difference between actual and forecast values, and it also adjusts for the volume of data. We found that the mean absolute percentage error for each model was 4.041 (for ARIMA), 4.049 (for ARIMAX), and 4.039 (for SARIMAX). The improvement from ARIMA to SARIMAX was therefore only 0.06%, which is very nominal. Because of this, we determined that the best approach going forward would be to use the ARIMA model, since it is still fairly accurate and it only requires weight data, making it more feasible for applying this model to Kendeda hive data, which is our ultimate goal for this sub-project.
Application
In order to put this model into production, we decided to serialize the model and connect it to an AWS EC2 instance, which would allow other users to access a basic web application where they could input a hive weight dataset and receive predictions for the next 5 days' worth of hive weight values. In order to serialize the model, we used a Python package called pickle. This serialized model would then be loaded in a Flask app, where it would be fit to input data in order to make predictions on that data. This flask app was then finally connected to the AWS EC2 instance, making the prediction process accessible to all users.
Bird Classification
To assist the Biodiversity team in learning more about the bird species around the Kendeda Building, we developed two models, one to classify birds based on images and one to classify birds based on sound.
Methods
The first step was to collect the data. For the bird images, this was a simple task since we simply found a dataset on kaggle that would meet our needs. For bird sound data, this was a tougher task. Dr. Weigel suggested a few websites for us to look into but that did not work out since you could only download sounds one at a time. For a machine learning model we would need a lot more data, so we went to kaggle and found a dataset, but it was too large for our uses and occupied around 25 GB of space (this would lead to very slow upload/download times). We decided to use DGX (the supercomputer on campus) to download these files and extract only 10 bird species worth of sound data so that we can train the model.
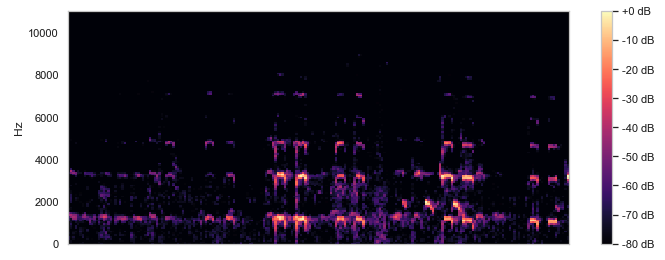
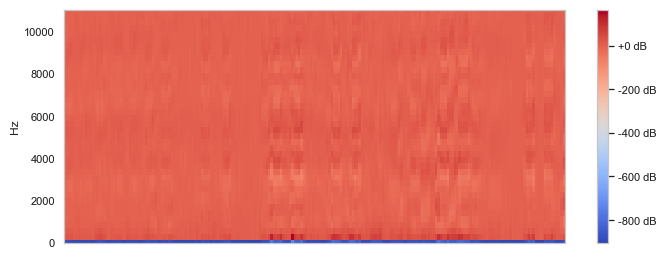
Next we had to actually construct the models. With the image data we could preprocess the data and feed it into a convolutional neural network (CNN) to train and validate with testing data. We separated the test data and training data by a ratio of 0.25 and fit them into the VGG model, ReduceLROnPlateau, and Mobilenet's. This takes around an hour to run and we would have to tune the model based on accuracy. For the sound data, we had a bit more work to do since sound data is not really suited well for a CNN. So we decided to map all of our MP3 files to spectrograms by using the Python Librosa module. After research, we found that we cannot preprocess spectrograms like traditional image data, so we had to process the sound frequencies and we decided to remove the low frequency sounds since bird songs are high frequency. We then stored both the unprocessed and the processed spectrograms as PNG image files and fed them into CNNs.
Above are example images of the spectrograms created after we converted a given audio file. These images were used in the CNN model as training and test data.
Results
The bird image classification model had around 96% training accuracy and 89% test accuracy.
The bird sound classification model had around 25% accuracy with the processed spectrograms and a 86.2% accuracy with the unprocessed spectrograms.
When analyzing the images, we could tell that the processed spectrograms did not have many distinguishing features, but in the unprocessed spectrograms there is a clear contrast between the black and the purple/yellow bars. This may be why the model had a significantly higher accuracy since it is able to distinguish the sound waves a lot clearer.
Future Work
For the bird sound model, we trained the model with only 10 species so we would have to work on collecting more data and increasing the number of species and retraining the model. Once that is completed, the next step would be feed the raw data collected on campus into our model and see how the predictions are.
Varroa Mite Detection
[Spring 2021 - Present]
We learned that varroa mites can be very destructive to bee hives, hence being one of the biggest threats to the bee population as a whole. At the early stages of varroa infestation, bee colonies generally show very few symptoms. If varroa mites can be detected early on, beekeepers could eliminate them and save their hives. With the aim of protecting and promoting bee health, we developed a an image classification model applying convolutional layers to detect varroa mites on honey bees.
Methods
To train the image classification model, we utilized images from Google and from the iNaturalist Dataset to find images of healthy bees and bees infected with varroa mites.
Results
The model was tuned and trained to eliminate overfitting and achieve a maximum accuracy of 63%.
Future Work
We suspected that the issues with underperformance of the model, despite of high accuracy during training and evaluation, was due to the difference in image resolution between images in the dataset and test images (even after image preprocessing on test images). In some lightings, the color difference between the bees and varroa mites are minimal, and this could make it hard for the model to distinguish between infected and healthy bees. We expect to have a camera set up by the hive at the Kendeda building, and the images taken by this camera will be used to test and tune the current varroa detection model for better performance.
Drone Data Analysis
[Fall 2021 - Present]
This project aims to analyze the data whose collection has been directed and supervised by Dr. Jennifer Leavey and Ms. Julia Mahood. We spent the majority of this semester to perform data cleaning and organized raw data for analysis purposes. Even though much work still needs to be done on data processing (more details can be found in the Future Work section), we attempted to address research questions posed by Dr. Leavey and Ms. Mahood using the data we currently have. The results will serve as a point of comparison as more complete data and analytical techniques are added to the project.
Methods
Data
Two hives are kept on the rooftop of the Kendeda Building, and each hive's entrance is equipped with a reader (the white component in the image below) that tracks whether a bee is coming or leaving the hive. Within the reader, there are two antennas (labeled 1 and 2 in the image). Intuitively, the orders of triggering 1-2 and 2-1 denote arrival and departure, respectively.
Processed data:
- Some data points are dropped due to errors incurred during data collection.
- Data is compiled so that each drone has a full history including:
- Identifiers: UID & tag ID
- Tag date (~ birth date)
- Start hive
- Directions in chronological order
- Timestamps and readers that correspond to directions
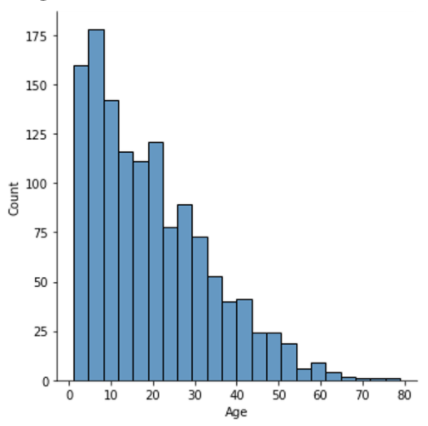
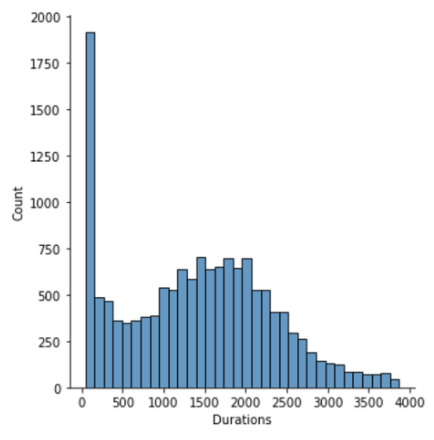
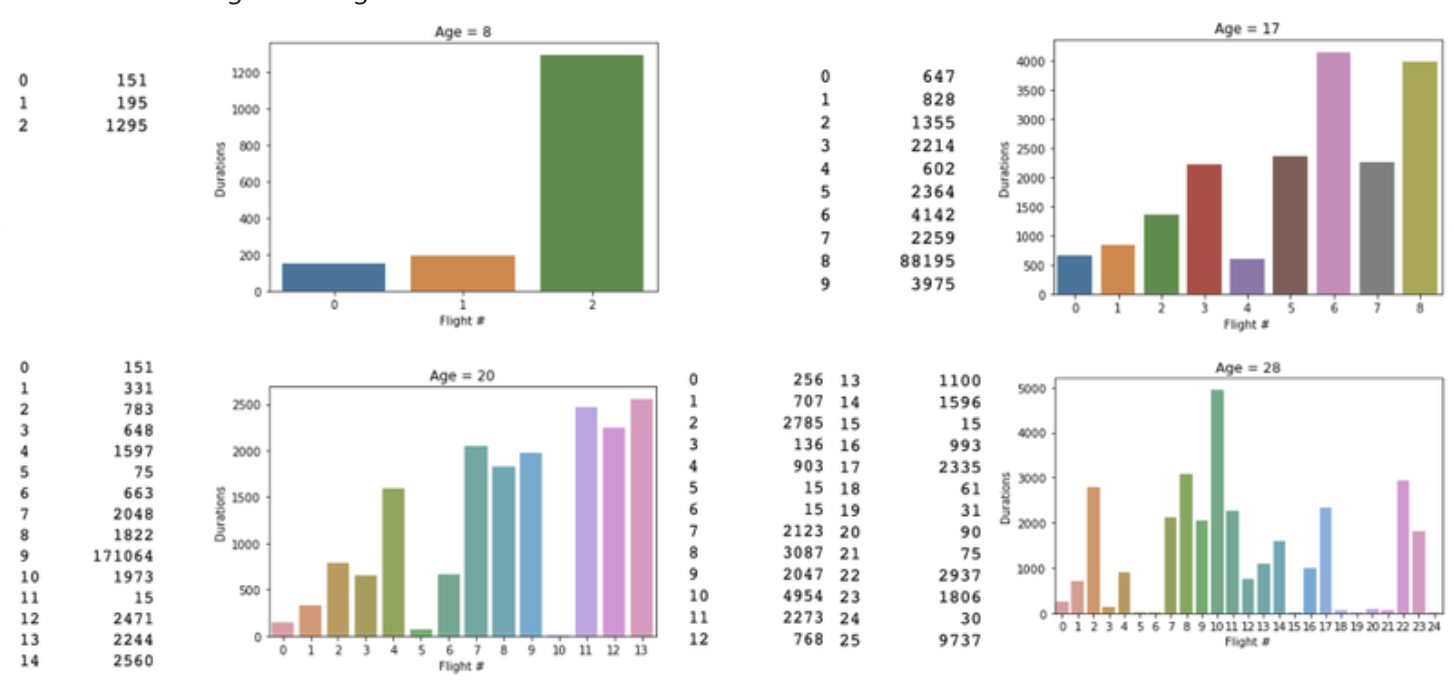
There are many data points whose directions are labeled as 'unknown'. Currently, the 'arriving' and 'departing' data points that form complete flights are used to draft graphs with hopes of finding some trends to better infer what the 'unknowns' could be.
Note: outliers are omitted in the graphs below
Ages:
Flight durations:
Some "more-obvious" flights during a drone's lifetime:
Results
Orientation-Flights-Related Questions
- What is the average age for a bee's first orientation flight?
- What was the average time for a bee's orientation flight?
- Did a bee take multiple orientation flights or just one?
Considerations
- Based on prior research, bees take their first orientation flights then they are around 6-9 days old, and an orientation flight typically lasts 1-6 minutes.
- For the flight time analysis, we considered flights that lasted 1-6 minutes to be classified as orientation flights.
- For the flight age analysis, we considered 5-10 days after birth to be a reasonable window to analyze flights. This was to account for first flights taken outside of the 6-9 day window that did not deviate far enough to be considered major outliers.
- Bees with unknown data were excluded.
Setup
- Much like the setup for the mating flight analysis, every bee is assigned a unique drone id, and each drone id has a list of flights associated with it (this was done in a preprocessing step, where raw arrival/departure data was converted into flights).
- Because the flight time for orientation and mating flights varies with such a great difference, we could easily give each flight an initial naïve classification, and we put these classifications into two lists: orientation flights and mating flights per bee. For this segment, we considered only orientation flights.
- To answer the average age question: first, we took the difference between time of date of first flight and the bee's birthday for each bee. Then, we calculated 1-variable statistics of all of these differences (mean, mode, five-number summary). We only considered bees that had orientation flight data recorded.
- To answer the average flight time: first, for each drone, we calculated the average time of all of its recorded orientation flights. Then, we calculated 1-variable statistics for these averages (mean, mode, five-number summary). We only considered bees that had orientation flight data recorded.
- To answer the frequency of flights questions: First, we created a two counters - one would hold the number of drones that recorded one orientation flight, and the other would hold the number of drones that recorded multiple orientation flights. For each drone, we counted the number of flights each had recorded and incremented the proper counter. We did not consider drones that took no flights or an outlandish number of flights.
Results
- Median age for first flight: 8 days. 423/681 considered drones took their first flight between 5-10 days of age
- Median flight time: 115.67 seconds. 560/701 considered drones had an average flight time between 1-6 minutes.
- Flight frequency: 616/709 considered drones took multiple flights
990 drones classified as not taking orientation flights. Possible reasons?
- Removed from hive shortly after being added
- Sensor malfunction
- Outliers
Mating-Flights-Related Questions
- What is the average age for a bee's first mating flight?
- What was the average time for a mating flight?
Considerations
- Bees with any unknown data were excluded
- A flight is considered a mating flight if it is between 25-35 minutes
Setup
- Data was setup to have a list of the number of flights per day for each drone id
- EX: 25SQCMICSBB88D5005AC3: {'2021-08-03': 1, '2021-08-04': 1, '2021-08-05': 6, '2021-08-06': 1, '2021-08-07': 1, '2021-08-09': 2, '2021-08-10': 1, '2021-08-13': 1, '2021-08-15': 1, '2021-08-20': 3, '2021-08-22': 1, '2021-08-24': 1, '2021-08-26': 1, '2021-08-29': 1, '2021-09-01': 2, '2021-09-02': 2, '2021-09-03': 2, '2021-09-04': 2, '2021-09-08': 3, '2021-09-10': 1, '2021-09-11': 2, '2021-09-13': 2}}
- A different list had the date of the first mating flight for each drone
- The average was just taking the total minutes of mating flights done by all the known bees over the number of bees who have done at least 1 mating flight
Results
- Average Age for First Mating Flight: 10 days
- Average Length of Flight: 30.2 minutes
- Average Flight per Day: 3.3 trips
Current Goals
- Experimental Model: Study how different sizes of mason bees affect their reproduction
- Data Scraping : Complete the program that can save clips of bees as MP4 videos from an active livestream.
- Bee Analysis (ML): Successfully develop the algorithm for detection of video bee movement through machine learning techniques.
- Hive Comparison: Build another hive to introduce the variable of temperature.
- Beautify Code: Clarify and annotate previous code using comments and reusable code.
- Cloud Data: Open up access to cloud computing to not save the downloaded clips locally, which in terms of spacial complexities provide RAM and memory limitations
Our New Process
- In the Fall of 2024, we have pivoted to an entirely new method of a machine learning method, by instead using OpenCV computer vision software instead of a YOLOv5 PyTorch artificial intelligence model, though the use of Python remains the same
- Instead of the Arduino IDE and KAP sensor, we are now using the livestream of the Kendeda Roof provided by the Urban Honey Bee Project
https://www.youtube.com/watch?v=OlwC1weFdAg
- We are trying to detect bees on the livestream, then algorithmically record and save a clip to our local computers, then eventually save these to the cloud to save space and improve efficiency
- Moreover, we are setting up data tables on data science tools and software such as NumPy.
- Our new processes prevent the numerous errors provided by the type of network used by the old camera, connections to the sensor, and general failings of the previous A.I. models
- We hope to complete the program portion by the end of the Fall Semester, specifically the data scraping portion (higher priority that extremely accurate detection of bees)
- We have already constructed our first bee hive for the mason bees, and are beginning the construction of the second to introduce another experimental variable, and retain a control hive
Project Updates
Fall 2024 [In Progress]
GitHub: https://github.com/palomacardozo/VIP-Machine-Learning-Fall-2024
Spring 2024
GitHub:
Fall 2023
GitHub:
Spring 2023
Project Hiatus
Fall 2022
Project Hiatus
Spring 2022
Github: This semester's work!
Fall 2021
GitHub Repos: Drone Analysis, Birds
Spring 2021
GitHub Repos: Hive Analysis, Varroa, Birds
Fall 2020
Spring 2020
Team Members
| Name | Major | Years Active |
|---|---|---|
| Kya Stutzmann | Neuroscience | Fall 2024 - Present |
| Ava Sanchez | Biology | Fall 2024 - Present |
| Paloma Cardozo | Computer Science | Spring 2024 - Present |
| Shanaya Bharucha | Computer Science | Fall 2023 - Present |
| Ansley Nguyen | Industrial Engineering | Fall 2023 - Present |
| Sukhesh Nuthalapati | Computer Science | Spring 2020 - Spring 2021 |
| Rishab Solanki | Computer Science | Spring 2020 - Spring 2021 |
| Sneh Shah | Computer Science | Spring 2020 - Spring 2021 |
| Jonathan Wu | Computer Science | Spring 2020 - Spring 2021 |
| Daniel Tan | Computer Science | Fall 2020 - Fall 2021 |
| Quynh Trinh | Computer Science | Fall 2020 - Fall 2021 |
| Chloe Devre | Computer Science | Fall 2021 - Fall 2022 |
| Crystal Phiri | Computer Science | Fall 2021 - Fall 2022 |
| Sarang Desai | Computer Science | Fall 2021 - Fall 2022 |

