Indoor pm2.5 graph kendeda vs culc.png
From Living Building Science
No higher resolution available.
Indoor_pm2.5_graph_kendeda_vs_culc.png (686 × 392 pixels, file size: 24 KB, MIME type: image/png)
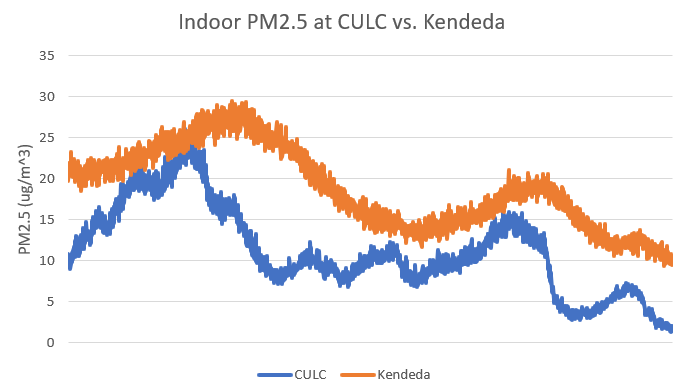
graph showing trends in indoor sensor data at the Kendeda and CULC
File history
Click on a date/time to view the file as it appeared at that time.
| Date/Time | Thumbnail | Dimensions | User | Comment | |
|---|---|---|---|---|---|
| current | 16:38, 20 April 2020 | | 686 × 392 (24 KB) | Cmiley3 (talk | contribs) |
You cannot overwrite this file.
File usage
There are no pages that use this file.